
Figure 1.
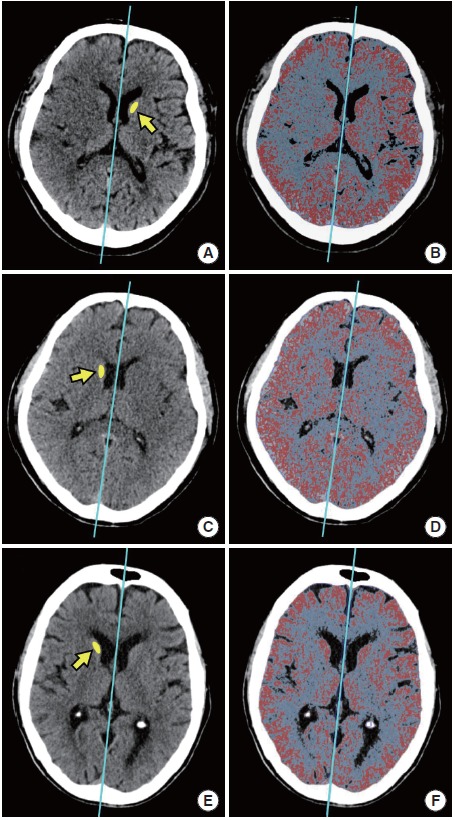
Representative figures of GRAVES measurements. Representative measurements of GRAVES in a patient with large core (GRAVES, 19.75; ASPECTS, 1; A and B), moderate core (GRAVES, 12.93; ASPECTS, 6; C, D), and small core (GRAVES, 1.92; ASPECTS, 10; E and F) are shown. Central lines that separate the hemispheres are drawn automatically and can be adjusted by a rater. The reference values of Hounsfield unit (HU) for the gray matter are determined by drawing a region of interest on the contralateral caudate head (yellow-colored area indicated arrow; A, C, and E). Then, computer software automatically analyzes the mean HU of region of interest. Red colored pixels are the area of which the values of HU are between the mean HU of the contralateral caudate head (HUcaudate) and HUcaudate + 9. These represent estimated normal gray matter. Blue-colored pixels are the area of which the values of HU are between 20 and 55. These represent estimated normal brain parenchyme (B, D, and F). GRAVES, Gray-matter Volume Estimate Score; ASPECTS, Alberta Stroke Program Early CT Score.