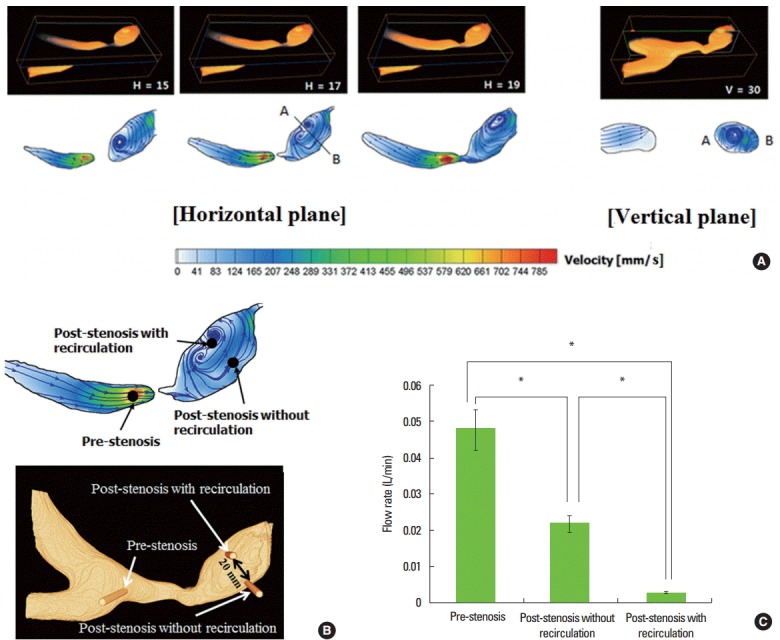
Figure 3.

Hemodynamic estimation showing recirculating flow and decreased flow rate through perforator. (A) Recirculating flow in the post-stenotic area, (B and C) Lower flow rates through microtubules inserted into the area with recirculating flow; H and V indicates the slice numbers of horizontal and vertical planes.
