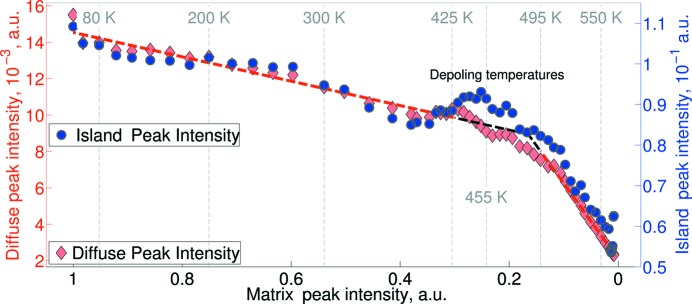
Figure 8.
Relationships between the intensities of the matrix Bragg peak, diffuse streaks (diamonds) and island (circles) Bragg peaks. The dashed red lines display the results of the linear regression in the two different temperature ranges: below 425 K and above 495 K. The change of the linear regression coefficient connecting the intensity of the diffuse scattering as a function of the matrix peak intensity points to the ‘virtual’ transition, involving the modification of the fine disorder parameter at these temperatures.

