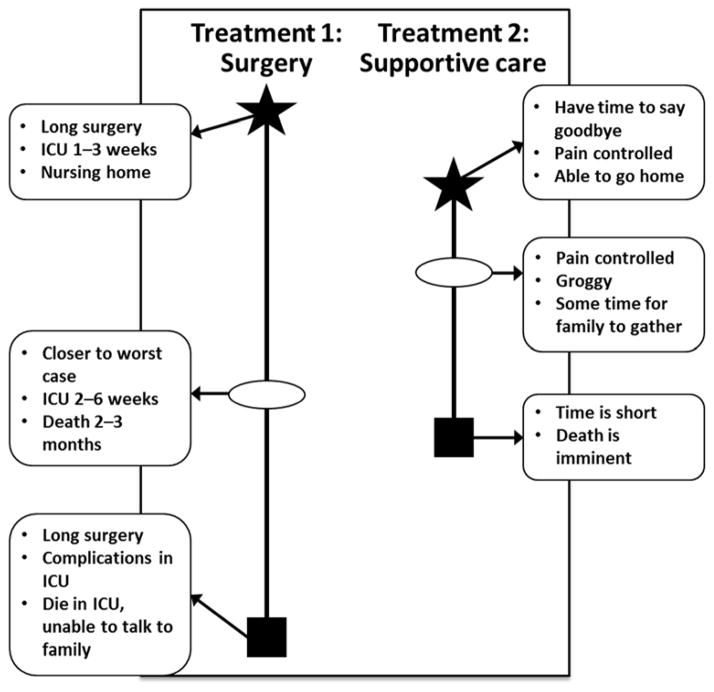
Figure 1.
The “best case/worst case” tool involves the drawing of a pen-and-paper diagram by the physician. Each treatment option is depicted by a vertical bar, and the length of the bar represents the range of possible outcomes. The “best case” is represented by a star, the “worst case” by a box, and the “most likely” outcome by an oval. The physician describes each “case” using narrative derived from clinical experience and relevant evidence, and writes key points on the diagram. Abbreviation: ICU, intensive care unit.

