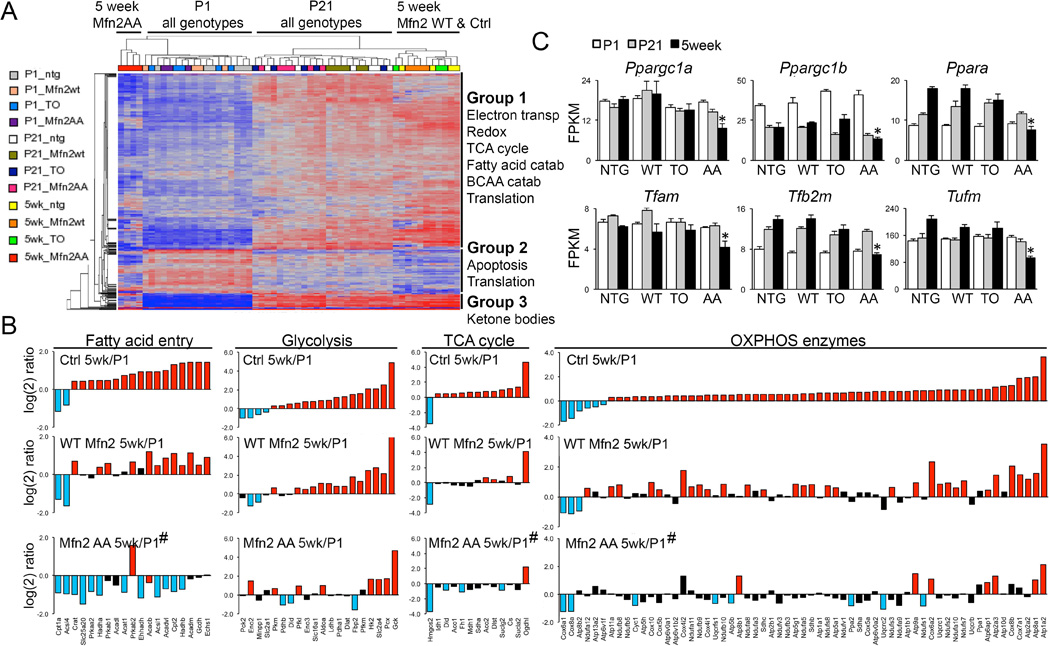
Fig. 6. Failure of metabolic gene reprogramming after perinatal Mfn2 AA expression.

(A) Heat map of mitochondrial gene expression in P1, P21, and 5 week mouse hearts; functional annotation of Mfn2 AA gene clusters is to the right. (B) Postnatal reprogramming of mitochondrial genes by metabolic function. Bars are mean values from results in Fig 4B; log(2) gene expression at 5 weeks vs P1 for Ctrl (top), WT Mfn2 (middle) and Mfn2 AA (lower) hearts. Blue and red bars are significantly down and upregulated, respectively (1.25 fold, FDR <0.02); black bars are not significantly regulated. (C) Regulated expression of mitochondrial biogenesis and replication genes during the perinatal-adult transition.
* = FDR<0.02 vs littermate control mice (TO). # is p<0.0001 vs WT Mfn2 (2-way ANOVA).
