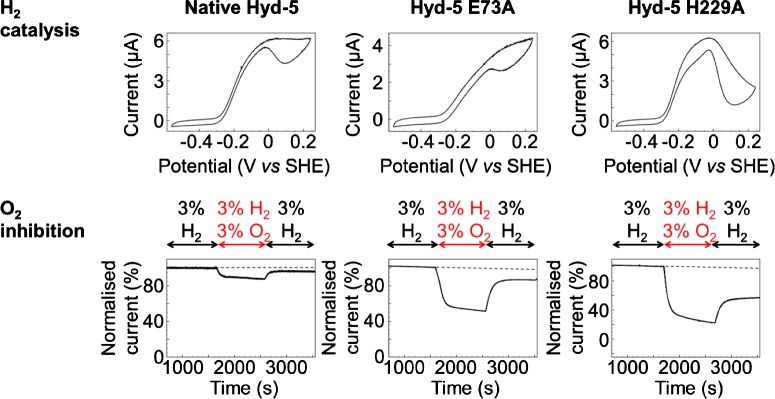
Figure 13. Electrochemical characterization of the catalytic (top) and O2 inhibition properties (bottom) of different proximal cluster variants (left to right) of S. enterica Hyd-5.
The 5 mV s−1 cyclic voltammetry H2 catalysis experiments were measured under a gas atmosphere of 10% H2 while the chronoamperometry O2 inhibition experiments were conducted at a potential of +0.06 V versus SHE with changing gas atmosphere as indicated. Other experimental conditions: pH 6, 37°C, rotation rate 4000 rpm and total gas flow rate of 100 scc min−1 with N2 as carrier gas.

