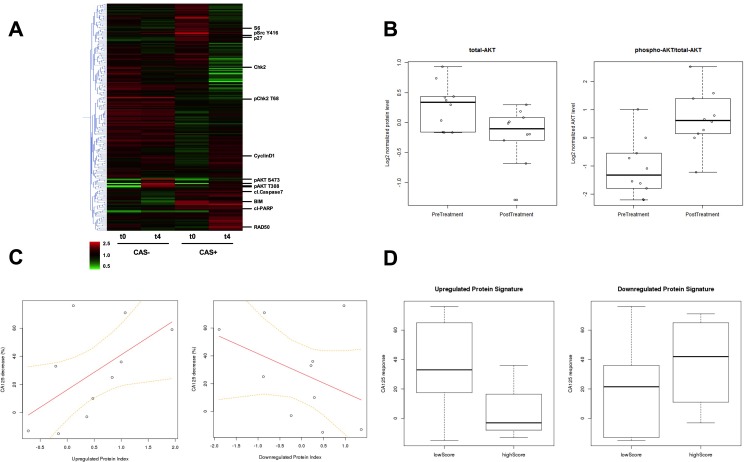
Figure 5.
A. Hierarchical clustering heatmap of protein expression detected in RPPA from pre-treatment and W4 on-treatment biopsies. CAS+: patient group with clinical activity signal, and CAS-: patient group with no clinical activity signal are indicated. t0: pre-treatment and t4: W4 on-treatment biopsy samples. The expression level for each protein from each patient at a given time point in the CAS or non-CAS population is averaged and displayed in the heatmap, with data for each protein median centered. Red indicates an increase in expression and green represents a decrease in expression with respect to the median. Examples of significant proteins identified in the analysis are indicated individually. B. Comparison of the average levels of total AKT and the ratio of phospho-AKT/total-AKT between pre-treatment biopsies (n = 12) and the biopsies taken following 4 weeks of treatment with GSK2141795 (n = 10) for all patients. Total AKT decrease student's t-test p = 0.02; phospho-AKT/total-AKT increase student's t-test p = 0.006 C. Correlation between clinical response to administration of GSK2141795 and pharmacologically-induced change in protein expression profile for AKT-inhibition signature. Percentage decrease in patients' CA125 levels is plotted against the difference in AKT-inhibition proteomic signature z-scores between pre-treatment biopsy and the biopsy taken following 4 weeks of treatment with GSK2141795 (n = 10 pairs) for the up- and down-regulated protein signatures (Table 1). T distribution of Pearson correlation coefficient gives p = 0.082 for up-regulated protein signature. D. Comparison of treatment-induced decrease in CA125 (as a percentage of pre-treatment level) following 4 weeks of treatment with GSK2141795 in patients with low versus high pre-treatment levels of the up- and down-regulated AKT-inhibition proteomic signatures (Table 1). T distribution of Pearson correlation coefficient between CA125 decrease and up-regulated proteomic signature score gives p = 0.041. CAS: clinical activity signal. CAS+ >30% CA125 decrease. CAS- < 30% CA125 decrease.

