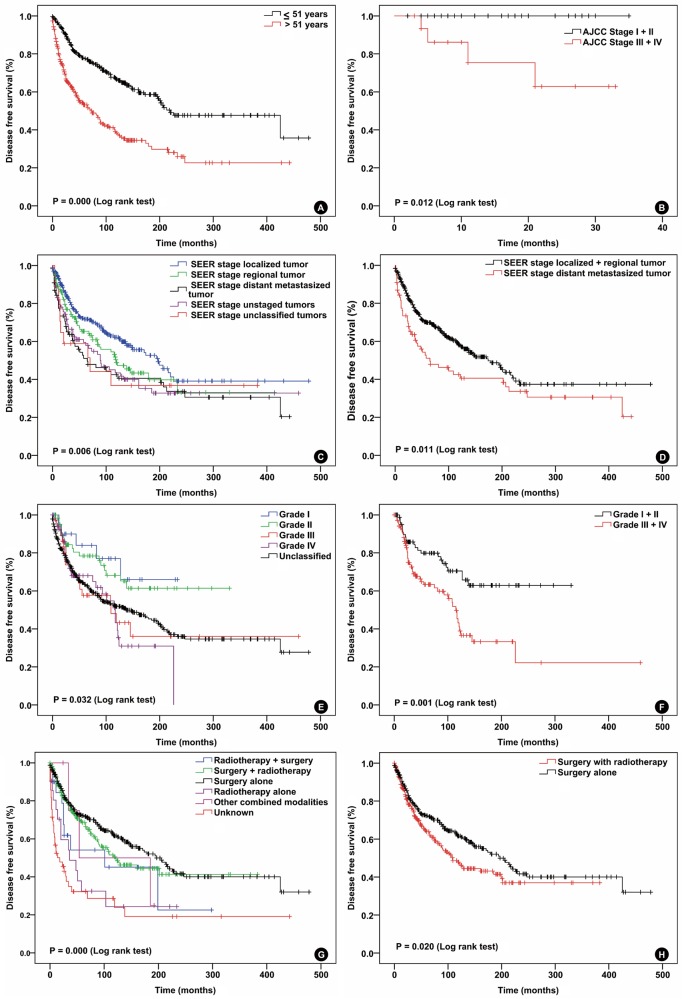
Figure 1.
Disease specific survival curves of patients with solitary fibrous tumor compared according to A. age, B. AJCC stage, C. and D. SEER stage, E. and F. pathologic grade, G. and H. treatment modalities Log-rank test was used to compare curves, and significance (P value) is shown on each panel.

