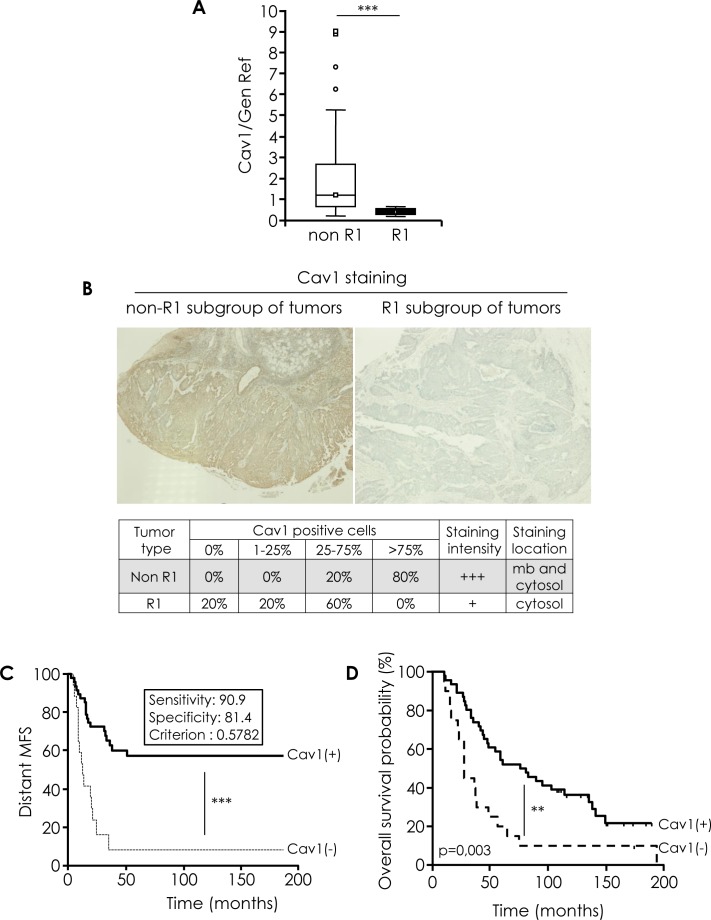
Figure 1. Cav1 expression in human HNSCC tissue specimens.
A. Quantified analysis of CAV1 transcripts determined in 11 primary tumor samples of patients that developed metastasis (“R1”) and 57 primary tumor samples of patients that did not developed metastasis (“non-R1”). The line within the bar represents the mean value and “o” represent individual data point. (***p < 0.001). B. Immunohistochemical analysis of Cav1 in R1 and non-R1 FFPE tissus (original magnification: X100). Table show % of non-R1 and R1 tumors with 0%, 1-25%, 25-75% and >75% Cav1-positive cells. C. Kaplan-Meier analysis of the distant metastasis-free survival (MFS) in patients stratified according Cav1 gene expression (CAV1(+) and CAV1 (−)). A cut-off value was determined for Cav1 gene expression (measured by qRT-PCR), corresponding to a 90.1% sensitivity and a 81.4% specificity with respect to the “R1” status (i.e. 90.1% of the “R1” lesions display a Cav1 expression level below this cut-off, and 81.4% of the “non-R1” tumours express Cav1 levels above this cut-off. More detail in suppl. material and methods). Samples were considered as Cav1-negative is the qRT-PCR value was ≤ to the cut-off. Shorter time to metastasis ***p < 0.001). D. Kaplan-Meier analysis of the overall survival (OS) in patients stratified according Cav1 gene expression (CAV1(+) and CAV1 (−)) as described in Fig 1C. Shorter time to death, **p = 0.003).

