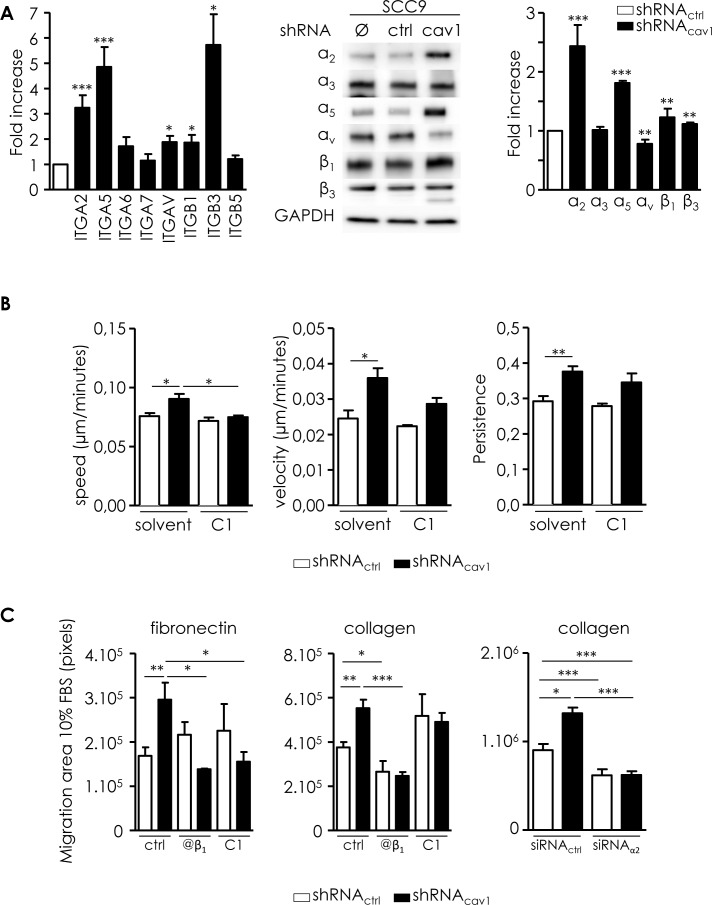
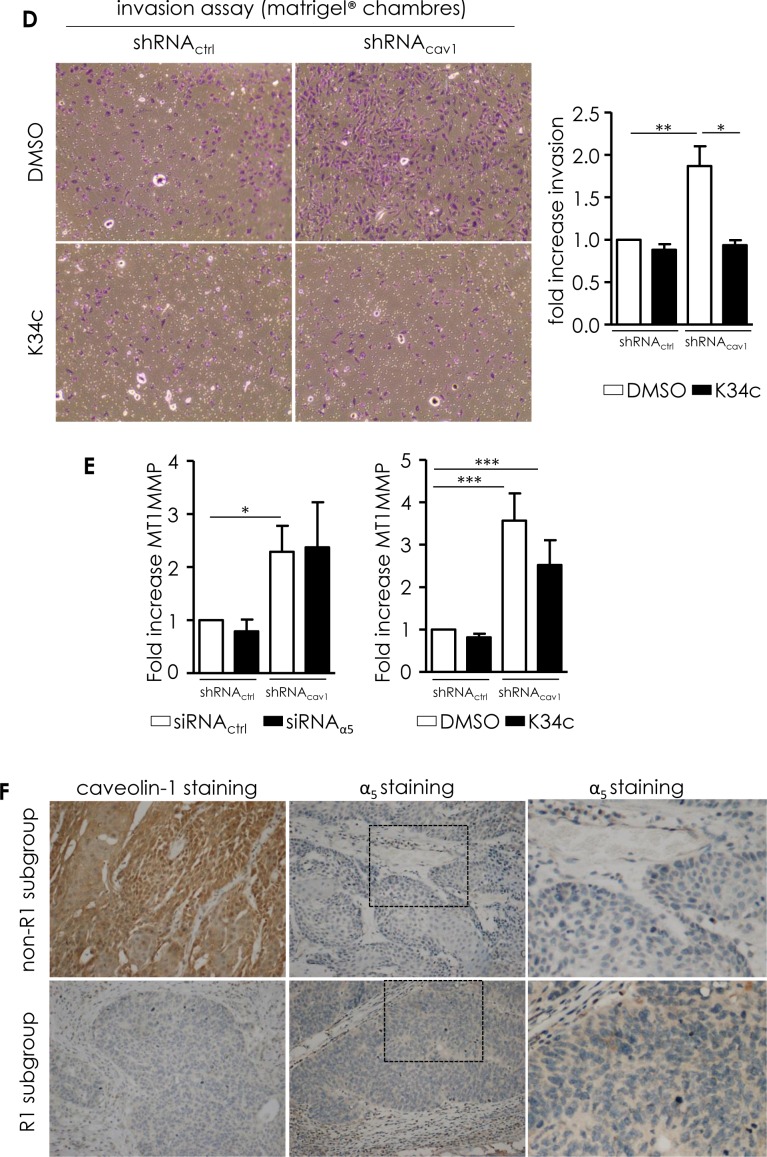
Figure 3. Integrins are involved in the motile and invasive properties of low Cav1 expressing cells.
A. Left panel: quantitative determination of transcripts expression of integrins (α2, α5, α6, α7, αv, β1, β3, β5 integrin subunits) in shRNActrl- or shRNAcav1-SCC9 cells using qRT-PCR with RNA18S as control. Each bar represents the mean±SEM with *p < 0.05, and ***p < 0.001. Right panel: integrin subunit protein levels (α2, α3, α5, αv, β1 and β3 integrin subunits) were analyzed by western blot analysis using GAPDH as a loading control. Each bar represents the mean±SEM with **p < 0.01 and ***p < 0.001. B. Analysis of single cell migration of shRNActrl- and shRNAcav1-transfected SCC9. Migrating trajectories of shRNActrl- and shRNAcav1-transfected SCC9 exposed to solvent or to a specific α5β1 integrin antagonist component 1 (C1, 20μmol/L) were recorded during 6 hours. Each bar represents the mean±SEM of the speed, the velocity and the persistence recorded during 6h for each cell type (n = 3-5, *p < 0.05 and **p < 0.01). C. Analysis of collective cell migration of shRNActrl and shRNAcav1-transfected SCC9. Evasion of shRNActrl- and shRNAcav1-transfected SCC9 from spheroids exposed to solvent, to a specific α5β1 integrin antagonist component 1 (C1, 20 μmol/L) and to a β1 integrin specific blocking antibody OS2966 (10 μg/mL) were determined after 12 hours growth on fibronectin- or collagen-coated cells. Evasion of shRNActrl- and shRNAcav1-SCC9 transfected with siRNActrl or siRNAα2 from spheroids were determined after 12 hours growth on collagen-coated cells. Each bar represents the mean±SEM area covered by cells evading from the spheroid (n = 4, *p < 0.05, **p < 0.01 and ***p < 0.001). D. Phase contrast images showing the invasion of shRNActrl- and shRNAcav1-transfected SCC9 exposed to solvent or to a specific α5β1 integrin antagonist K34c (20 μmol/L) through BioCoat Matrigel® invasion chambers. Cells were stained with crystal violet after 22 hours invasion. Each bar represents the mean±SEM fold increase in invasion (n = 4-6, *p < 0.05 and **p < 0.01). E. Quantitative determination of transcripts expression of MT1-MMP in shRNActrl- or shRNAcav1-SCC9 cells transfected with siRNActrl and siRNAα5 integrin subunits or exposed to solvent and K34c (20 μmol/L) using qRT-PCR with RNA18S as control. Each bar represents the mean±SEM with *p < 0.05 and ***p < 0.001. F. Immunohistochemical (IHC) analysis of Cav1 (left panels) and α5 integrin subunit (middle panels) in representative “R1” and “non-R1” FFPE tissues are shown (original magnification: X200). Magnifications of insets shown in middle pictures are shown in the corresponding right panels (original magnification: X400).


