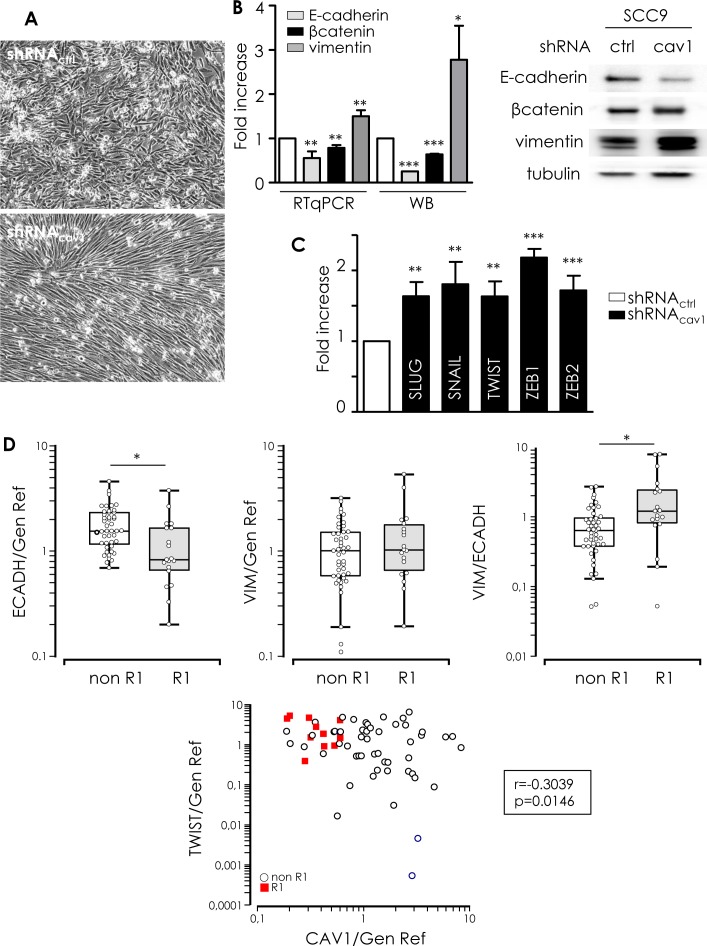
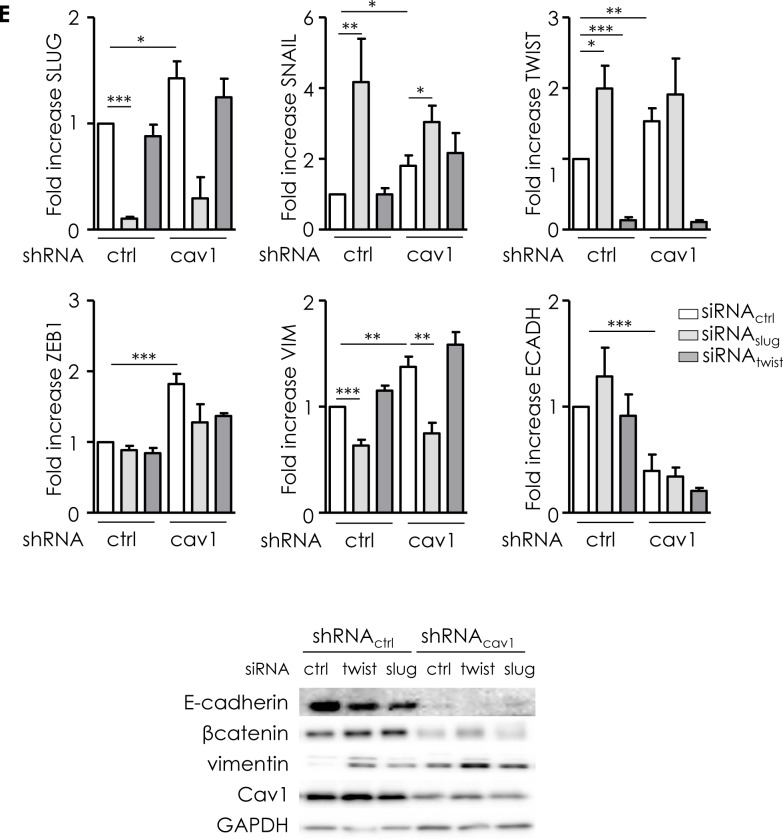
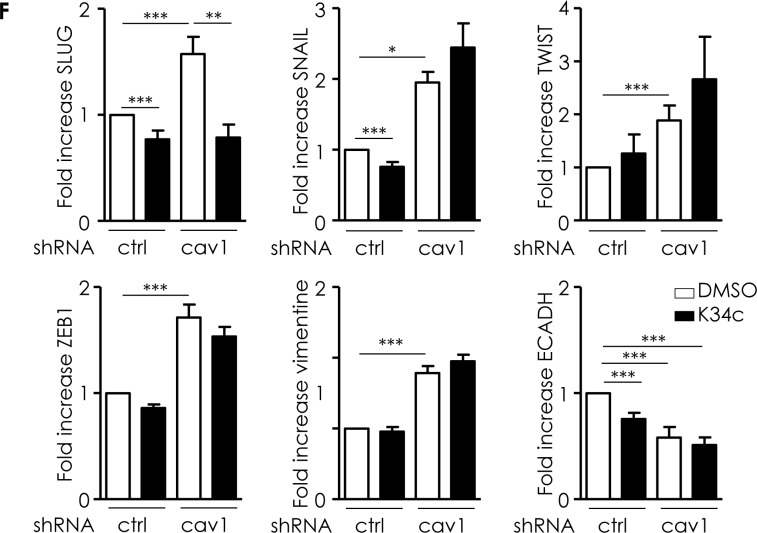
Figure 4. Low Cav1 expressing cells undergo an EMT.
A. Phase contrast images of stable SCC9 cells expressing shRNActrl or shRNAcav1 in culture. B. Quantitative determination of transcripts expression of epithelial (E-cadherin and β-catenin) and mesenchymal (vimentin) markers in shRNActrl- or shRNAcav1-SCC9 cells using qRT-PCR with RNA18S as control and western blot using tubulin as a loading control. Each bar represents the mean±SEM with **p < 0.01 and *** < p0.001. C. Quantitative determination of transcripts expression of key regulator of E-cadherin and EMT (including Slug, Snail, Twist, ZEB1 and ZEB2) in shRNActrl- or shRNAcav1-SCC9 cells using qRT-PCR with RNA18S as control. Each bar represents the mean±SEM with **p < 0.01 and ***p < 0.001. D. Quantified analysis of E-cadherin, vimentin, Twist and Cav1 transcripts determined in primary tumor samples of patients that developed metastasis (“R1”) and primary tumor samples of patients that did not developed metastasis (“non-R1”). The line within the bar represents the mean value and “o” represent individual data point. (***p < 0.001). E. Quantitative determination of transcripts expression of Slug, Snail, Twist, Zeb1, vimentin and E-cadherin in shRNActrl- or shRNAcav1-SCC9 cells transfected by siRNActrl or siRNASLUG or siRNATWIST using qRT-PCR with RNA18S as control. Each bar represents the mean±SEM with *p < 0.05, **p < 0.01 and *** < p0.001. F. Quantitative determination of transcripts expression of Slug, Snail, Twist, Zeb1, vimentin and E-cadherin in shRNActrl- or shRNAcav1-SCC9 cells exposed to DMSO or 20 μmol/L K34c using qRT-PCR with RNA18S as control. Each bar represents the mean±SEM with *p < 0.05, **p < 0.01 and *** < p0.001.


