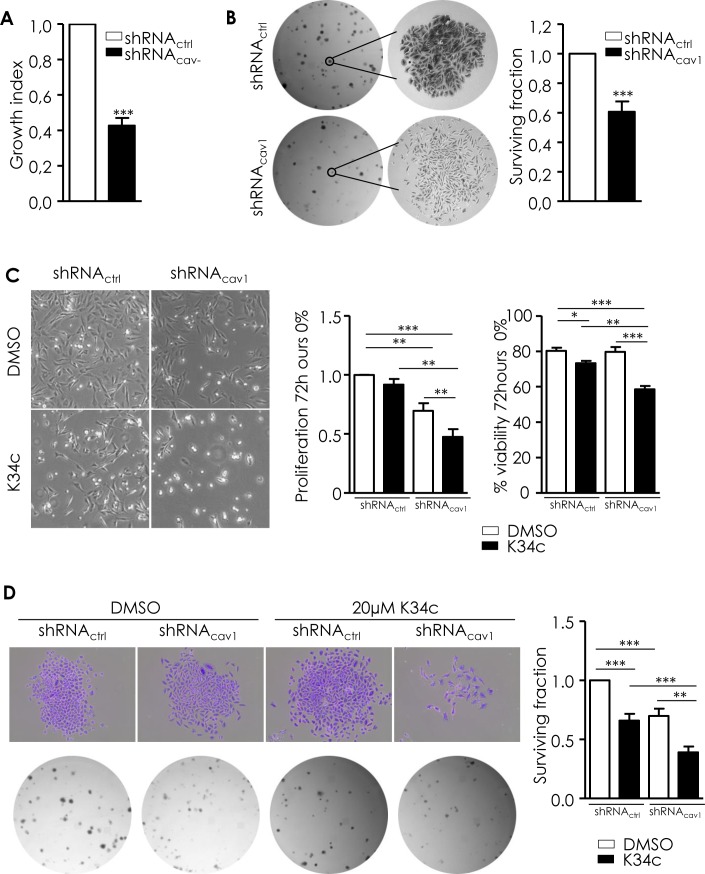
Figure 5. Low Cav1 expression is associated with a reduction of growth and survival capacities partially preserved by α5β1 integrins.
A. shRNActrl- and shRNAcav1-transfected SCC9 growth index was analyzed by regular cell counting using the TC20 counter (BioRad). Each bar represents the mean±SEM growth index of shRNAcav1- versus shRNActrl-transfected cells (n = 14, ***p < 0.001). B. ShRNActrl- and shRNAcav1- SCC9 were subjected to a clonogenic assay. Photograph represents phase contrast images of shRNActrl- and shRNAcav1- SCC9 colonies after staining with crystal violet. Each bar represents the mean±SEM surviving fraction of shRNAcav1- versus shRNActrl-transfected cells. Plating efficiency are 0.23±0.02, and 0.17±0.02 for shRNActrl and shRNAcav1-transfected SCC9 respectively (n = 17, ***p < 0.001). C. Phase contrast images of stable shRNActrl or shRNAcav1 SCC9 cells exposed to solvent or 20 μmol/L K34c up to 72 hours in 0% FBS containing medium. Each bar represents the mean±SEM number of cells and the percentage of proliferation and viability after trypan blue staining with *p < 0.05, **p < 0.01 and *** < p0.001. D. Phase contrast images of shRNActrl- and shRNAcav1- SCC9 colonies stained with crystal violet exposed to solvent or 20 μmol/L K34c up to 72 hours in 0% FBS containing medium. After refreshment, cells are allowed to grow 7 days in 10% FBS containing medium. Each bar represents the mean±SEM surviving fraction with **p < 0.01 and *** < p0.001.

