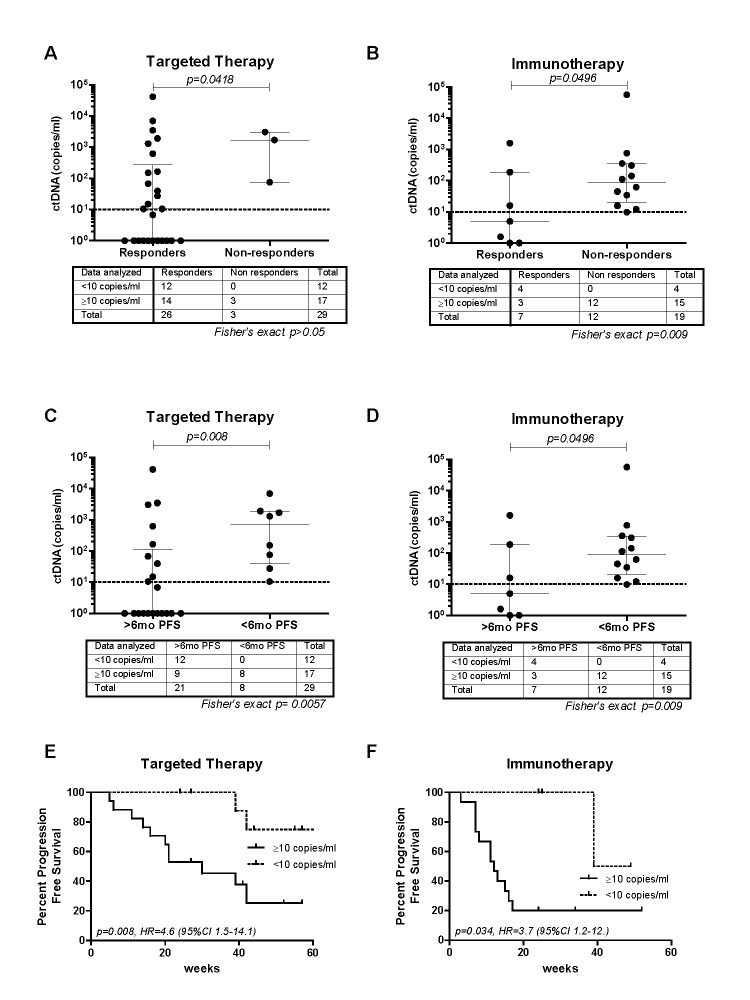
Figure 1. Baseline ctDNA association with response to treatment and PFS.
Association of baseline ctDNA concentrations with A. and B. response to treatment and C. and D. 6 months PFS. Median with interquartile range is indicated on each data set. Contingency tables with corresponding Fisher's exact test p-value are indicated below each graph. Kaplan-Meier plots of PFS probabilities according to baseline ctDNA concentrations of E. cases treated with targeted therapies (n = 29) and F. immunotherapies (n = 19). Cox regression p-values, Hazard ratio (HR) and confidence intervals are indicated for each plot.

