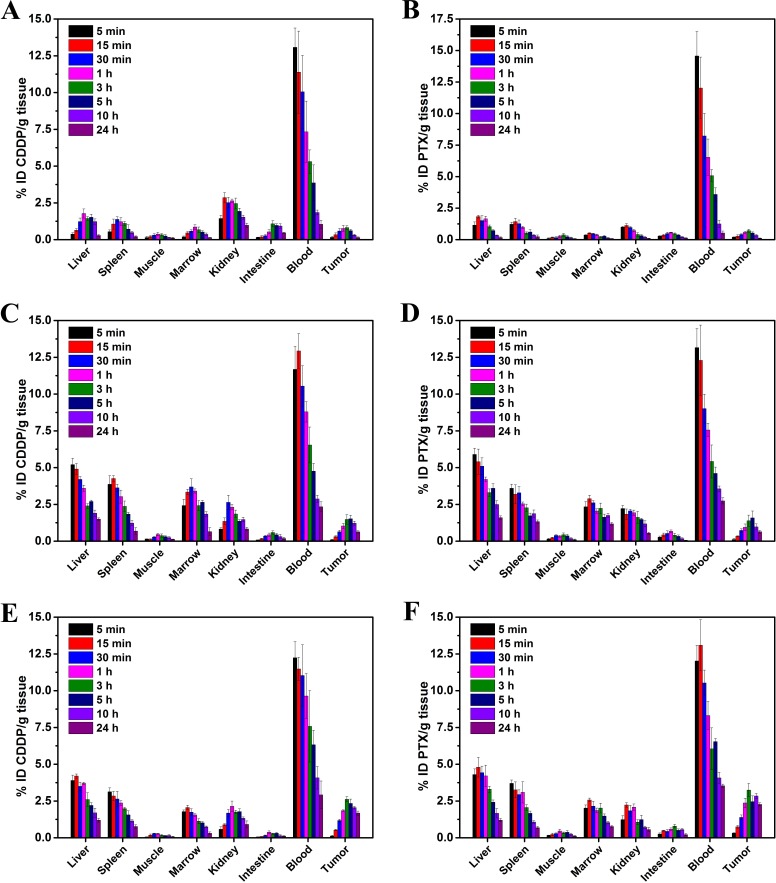
Figure 7. Tissue distribution studies of drug/NPs.
Tissue distribution of free-CDDP A., free-PTX B., the CDDP in Co-NPs C., the PTX in Co-NPs D., the CDDP in Co-FA-NPs E. and the PTX in Co-FA-NPs F. at time points of 5, 15, 30 min, 1, 3, 5, 10 and 24 h after intravenous injection of corresponding drug/NPs.

