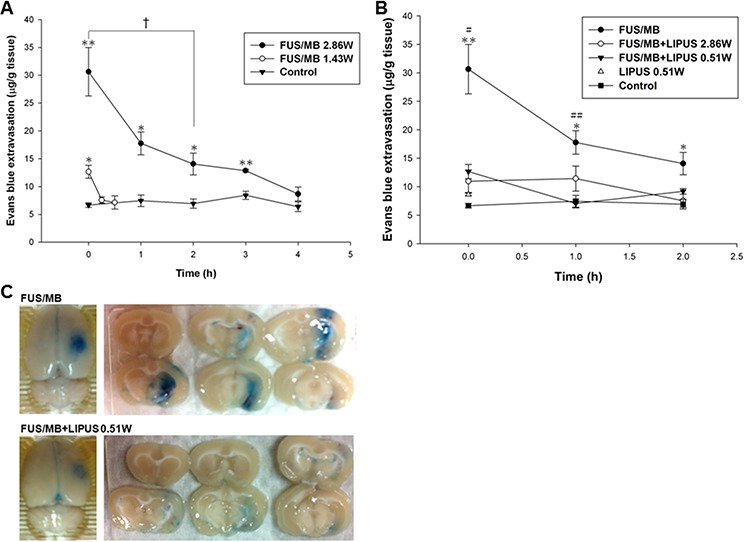
Figure 1. EB extravasation was assessed in the brain after sonication.

A. Graph shows the EB extravasation of 200 μL/kg UCA within 4 h after sonication in right and left (control group) brain hemispheres with and without sonication at an acoustic power of 1.43 or 2.86 W. B. Graph showing the amount of EB extravasation as a function of time after single or repeated sonication. EB extravasation was largest immediately after the sonications and rapidly decreased within 2 h. C. Distribution of BBBD for FUS/MB and FUS/MB+LIPUS group as evaluated by the extravasation of EB into the brain in the sonicated right hemisphere and the corresponding brain surface. * and # denote significantly different from control and FUS/MB+LIPUS group, respectively (*, # and †, p < 0.05; ** and ##, p < 0.01, n = 3).
