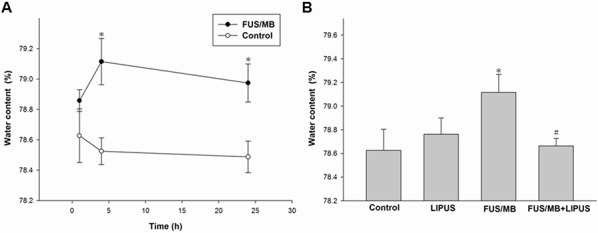
Figure 3. Assessment of cerebral water content induced by FUS/MB application.

A. Cerebral water contents at 1, 4, and 24 h after FUS/MB application. B. Water contents increased after FUS/MB and then significantly decreased after LIPUS treatment. * and # denote values significantly different from control and FUS/MB group, respectively (* and #, p < 0.05, n = 4).
