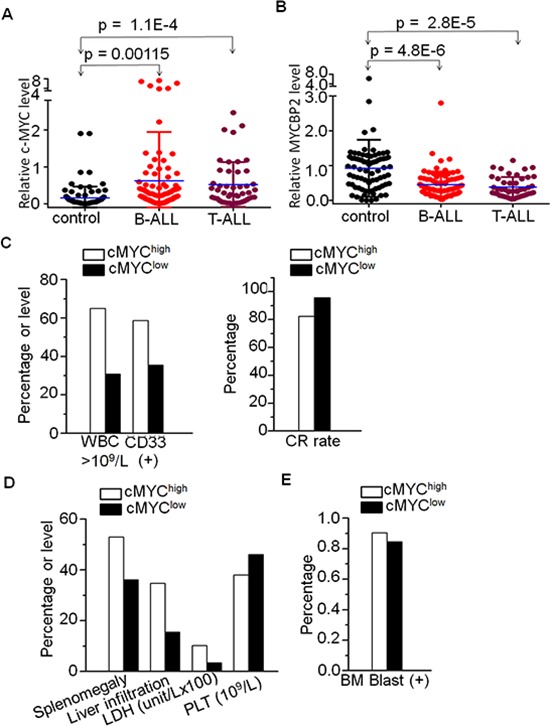
Figure 1. High c-MYC and low MYCBP2 expression and correlation with clinical features in ALL patients.

A. Comparison of c-MYC expression in B-ALL and T-ALL with normal BM control; B. Comparison of MYCBP2 expression in B-ALL and T-ALL with normal BM control; C. Correlation of high c-MYC expression with high risk factors (high WBC, CD13+ cells, and low CR rate); D–E. Correlation of high c-MYC expression with proliferation indicators.
