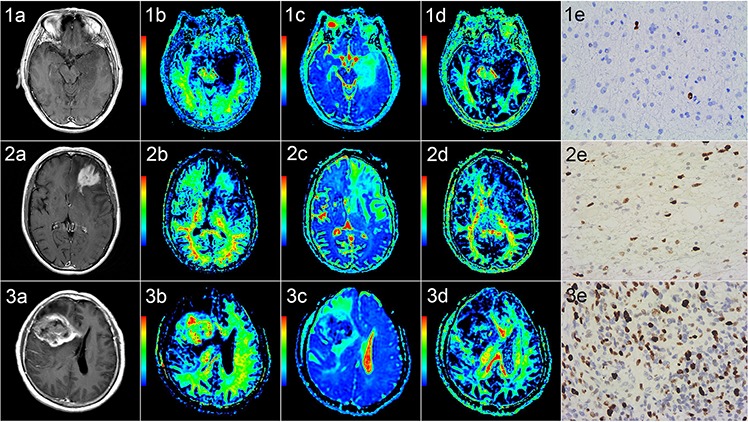
Figure 2. Correlation of diffusion kurtosis imaging with tumor grade and Ki-67.

Rows 1–3 correspond to three patients with diffuse astrocytoma (WHO grade II) in the left temporal lobe, anaplastic astrocytoma (WHO grade III) in the left frontal lobe and glioblastoma (WHO grade IV) in the right fronto-temporal lobe, respectively. Columns a-e are contrast-enhanced T1-FLAIR, MK, MD, FA and Ki-67 images (400 ×), respectively. For grade II gliomas, the intensity was low on MK and FA maps and high on MD maps, and the Ki-67 LI value was 2%. For grade III and grade IV gliomas, the intensity was high on MK maps and low on FA and MD maps, and the Ki-67 LI values were 30% and 45%, respectively. MK and Ki-67 increased (but MD decreased) as the grade increased, whereas FA showed no obvious trend.
T1-FLAIR: T1 fluid-attenuated inversion recovery; MK: mean kurtosis; MD: mean diffusivity; FA: fractional anisotropy; Ki-67 LI: Ki-67 labeling index.
