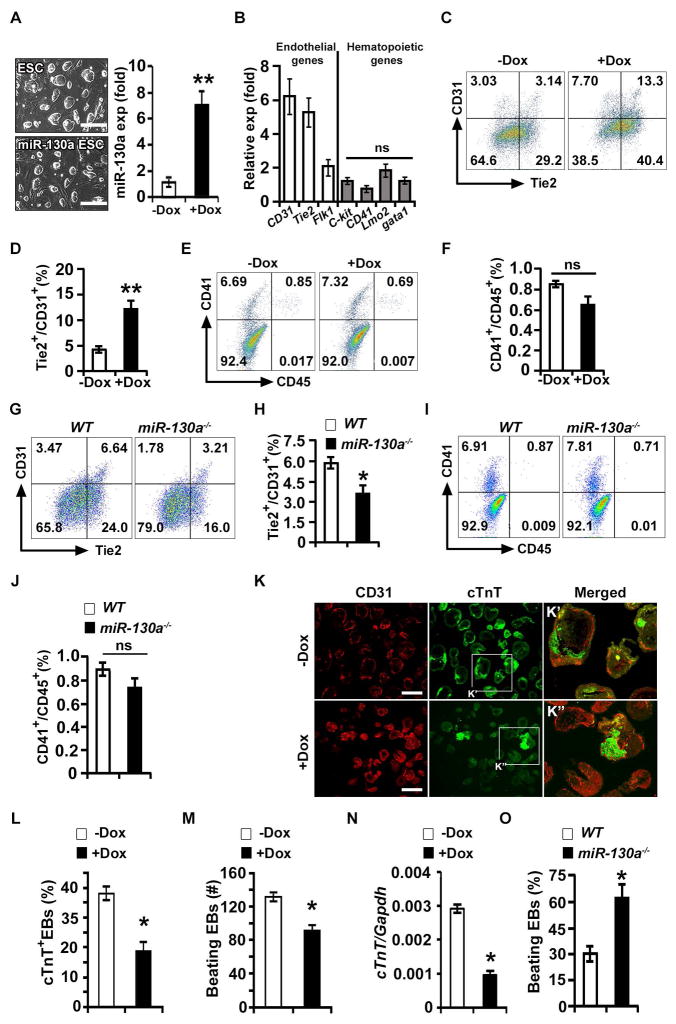
Figure 2. miR-130a promotes the endothelial lineage.
(A) Left panel: phase contrast images of wild-type E14 (ESCs) and Dox-inducible miR-130a ES cell (miR-130a iES) colonies. Right panel: qPCR analysis of miR-130a in the absence (−Dox) and presence of Dox (+Dox). (B) qPCR analyses for endothelial and hematopoietic markers using −Dox and +Dox EBs at d6 of differentiation (ratio shown as +Dox/−Dox). (C–F) FACS profiles (C, E) and quantification (D, F) of endothelial [Tie2 and CD31 (C, D)]; and hematopoietic [CD41 and CD45 (E, F)] markers in −Dox and +Dox conditions. (G–J) Representative FACS profiles (G, I) and quantification (H, J) of endothelial (G, H) and hematopoietic (I, J) markers in WT and miR130a−/− EBs. (K) Sections of −Dox and +Dox miR-130a iES/EBs immunostained with CD31 (red) and cTnT (green) at d10 of EB differentiation. Boxed regions are shown in panel K′ and K″. (L) Quantitative analysis of cTnT+ EBs in −Dox (n = 123) and +Dox (n = 142) EBs. (M) Contractility assay using −Dox (n = 146) and +Dox (n = 135) EBs. (N) qPCR analyses of a cardiac marker (cTnT) from −Dox and +Dox miR-130a iES/EBs. (O) Cardiogenic assay using WT and miR-130a−/− embryoid bodies. Error bars indicate SEM (n = 5; *p < 0.05). Scale bar: 200 μm, (see also Figure S2).

