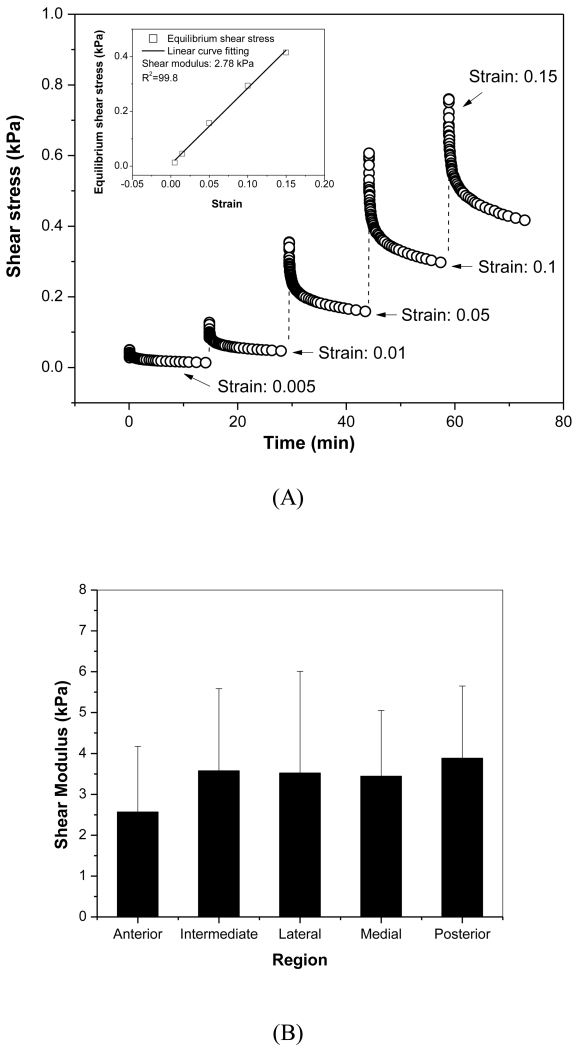
Figure 5.
A) Typical stress relaxation curve for disc sample from anterior region. The multi-strain levels included five steps (0.005, 0.01, 0.05, 0.1, 0.15). As shown in the inset plot, the shear equilibrium modulus was calculated from the slope of equilibrium stress versus strain curve generated from all five stress relaxation steps. B) Average ± standard deviation of regional shear equilibrium modulus.

