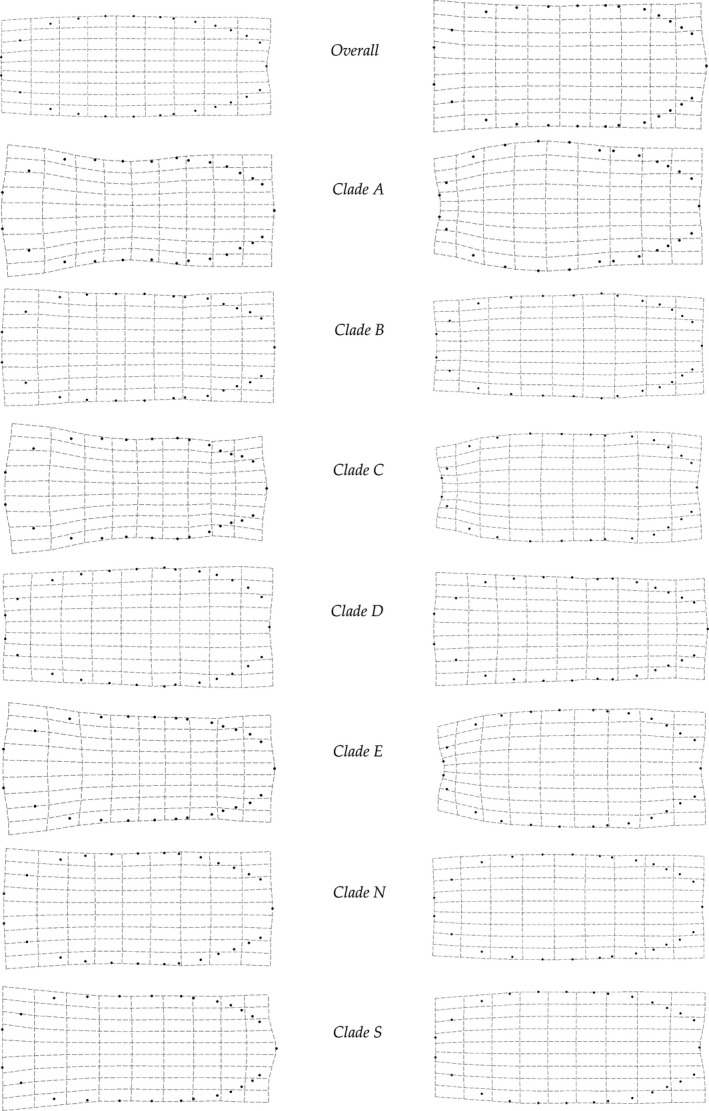
Figure 7.

Thin‐plate‐spline transformations of LM positions for Ligia size minima (left) and maxima (right) for the overall dataset, and for each lineage. Clade F is not presented due to small sample sizes. Transformations are shown at 3*X the natural range to aid visualization.
