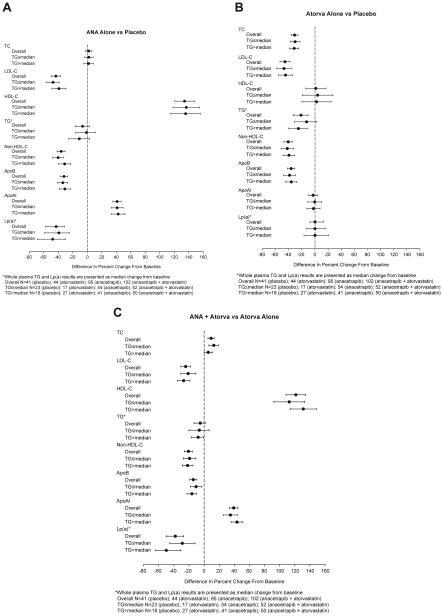
Figure 1.
Between-group differences in mean percent change from baseline for whole plasma lipid/apolipoprotein (apo) concentrations as assayed by standard techniques in the overall analysis population and subgroups defined by median baseline triglyceride (TG) value (≤ and >154 mg/dL). (A–C) Between-group differences for the placebo vs anacetrapib alone, placebo vs atorvastatin alone, and atorvastatin alone vs atorvastatin + anacetrapib treatment comparisons, respectively. Negative values favor anacetrapib alone or atorvastatin alone vs placebo or atorvastatin + anacetrapib vs atorvastatin alone except for high-density lipoprotein cholesterol (HDL-C) and apolipoprotein AI (apoAI). HDL-C, high-density lipoprotein cholesterol; Lp(a), lipoprotein a; TC, total cholesterol.

