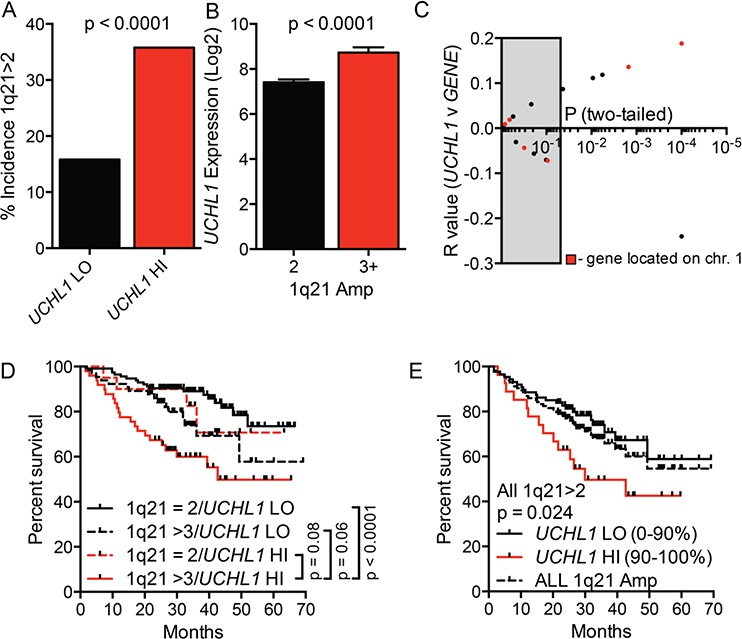
Figure 4. High UCHL1 levels correlate with amplification of chromosome 1q21.

A. The incidence of 1q21 amplification (>2 signals by FISH) in cases from GSE2658 according to the level of UCHL1. B. The level of UCHL1 in samples according to the number of signals for 1q21 as in (A) C. The degree of correlation (R value and p values) for the comparison between UCHL1 and each of the 17-genes included in the molecular definition of high-risk myeloma. The grey box indicates p values that are >0.05. The red dots represent genes localized to chromosome 1q. D, E. The overall disease-related survival was estimated using the Kaplan-Meyer method for cases classified based upon the number of 1q21 FISH signals and by UCHL1 level. P values were calculated using the Mantel-Cox log rank test.
