
Figure 3. AKT2 and AKT3 are positively correlated with ovarian cancer progression and glycolytic metabolism.
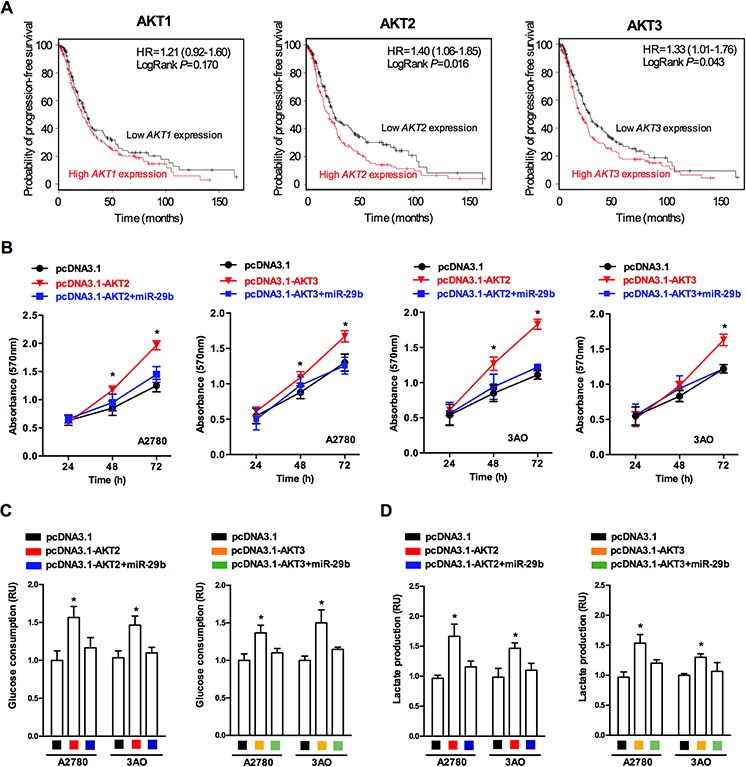
A. Survival rate prediction results show that AKT2/3 expression negatively correlates with ovarian cancer patients' probability of progression-free survival, while no statistically significance was observed between AKT1 expression and probability of progression-free survival; B. MTT assay results reveal that both AKT2 and AKT3 overexpression led to an increase in absorbance (OD value) at 570 nm in both A2780 and SKOV3 cells, while simultaneous overexpression of AKT2/3 and miR-29b lead to no significant change in absorbance (OD value) at 570 nm in both A2780 and SKOV3 cells; C. AKT2/3 overexpression lead to increased glucose consumption in both A2780 and SKOV3 cells, while simultaneous overexpression of AKT2/3 and miR-29b lead to no significant change in glucose consumption in both A2780 and SKOV3 cells. D. AKT2/3 overexpression lead to increased lactate production in both A2780 and SKOV3 cells, while simultaneous overexpression of AKT2/3 and miR-29b lead to no significant change in lactate production in both A2780 and SKOV3 cells. Data are presented as means ± SEM. *p < 0.05 versus control.