
Figure 6. Increased miR-29b expression suppresses xenograft tumor formation.
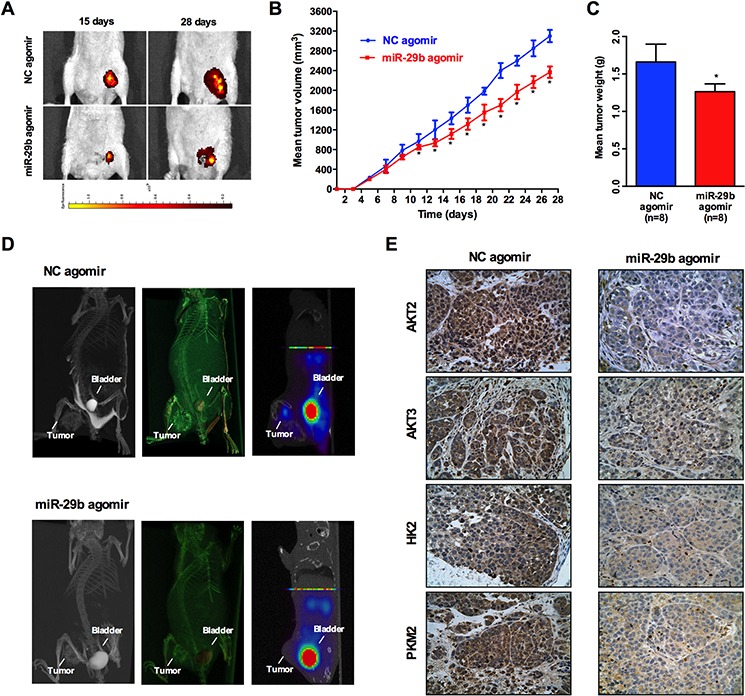
An in vivo tumor model was established by subcutaneous injection of 1 × 10⁶ SKOV3 cells pre-transfected with Ago-miR-29b or Ago-miR-NC. A. Comparison of tumor growth (volume increase) between miR-29b group and the negative control group (control). The volume of solid tumors was monitored every other day and measured using vernier calipers. The tumor volume (V) was measured with a formula of V = (L × W2) × 0.5 (n = 8/group); B. and C. The tumors were weighed immediately after isolation from mice. The tumor weight was plotted between the two groups; D. Representative maximum intensity projection(MIP) and Complete volume rendering images from CT scanning, and 18F-FDG PET images of tumors(from left to right) in Ago-miR-29b and Ago-miR-NC treated mice. Sites of tumors and bladders are indicated in each picture. E. and F. Immunohistochemical analysis of AKT2, AKT3, PKM2, and HK2 in Ago-miR-29b or Ago-miR-NC treated mice xenograft tumors. All IHC images were photographed under 400× magnification.