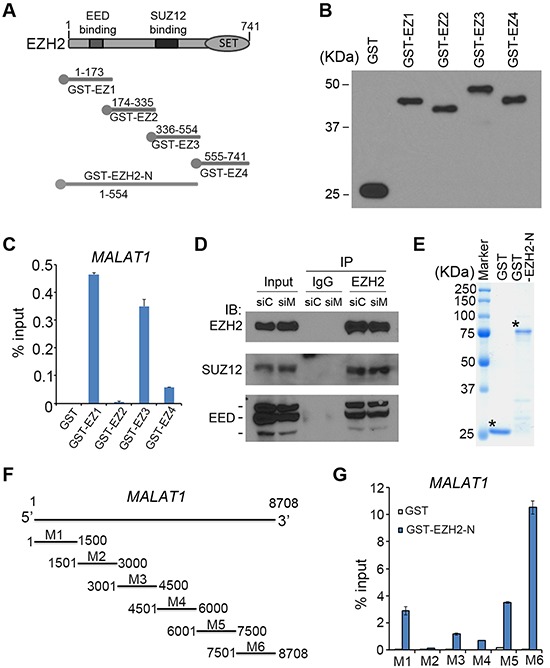
Figure 2. Analysis of the regions in MALAT1 and EZH2 responsible for their interaction.

A, B. Schematic diagram and western blot detection of GST and GST-EZH2 recombinant proteins indicated. C. RT-qPCR analysis of MALAT1 lncRNA pulled down by GST or GST-EZH2 recombinant proteins. Data are means ± S.D. from experiments with three replicates. D. C4-2 cells were transfected with non-specific control (siC) or a pool of MALAT1-specific siRNAs (siM) for 48 h and cells were harvested for immunoprecipitation using control IgG or EZH2 antibody and western blot using indicated antibodies. E. Coomassie blue staining of GST and GST-EZH2-N (amino acids 1–554) fusion protein. Asterisks indicate the proteins with correct molecular mass. F. Schematic diagram of MALAT1 regions M1-M6 used for GST pull down assays. G. RT-qPCR analysis of the in vitro transcribed different regions of MALAT1 lncRNA pulled down by GST or GST-EZH2-N (1–554) recombinant proteins. Data are means ± S.D. from experiments with three replicates.
