
Figure 2.
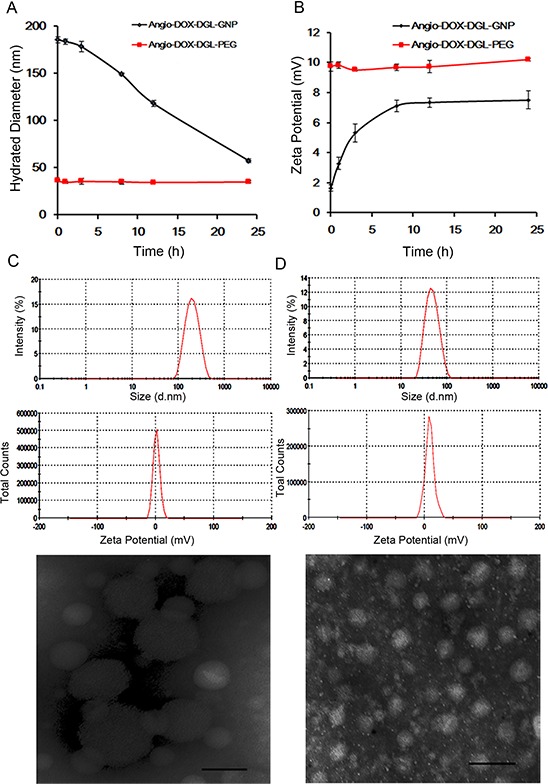
A. Hydrated Diameter of Angio-DOX-DGL-GNP and Angio-DOX-DGL-PEG incubated with MMP-2 during 24 h. B. Zeta Potential of Angio-DOX-DGL-GNP and Angio-DOX-DGL-PEG incubated with MMP-2 during 24 h. C. DLS data (Size distribution of Zeta potential) and TEM images of Angio-DOX-DGL-GNP before incubation with MMP-2, bar represents 100 nm. D. DLS data (Size distribution of Zeta potential) and TEM images of Angio-DOX-DGL-GNP after incubation with MMP-2 for 24 h, bar represents 100 nm.