
Figure 8. In vivo tumor distribution of DOX, Angio-DOX-DGL-PEG, DOX-GNP, DOX-DGL-GNP and Angio-DOX-DGL-GNP.
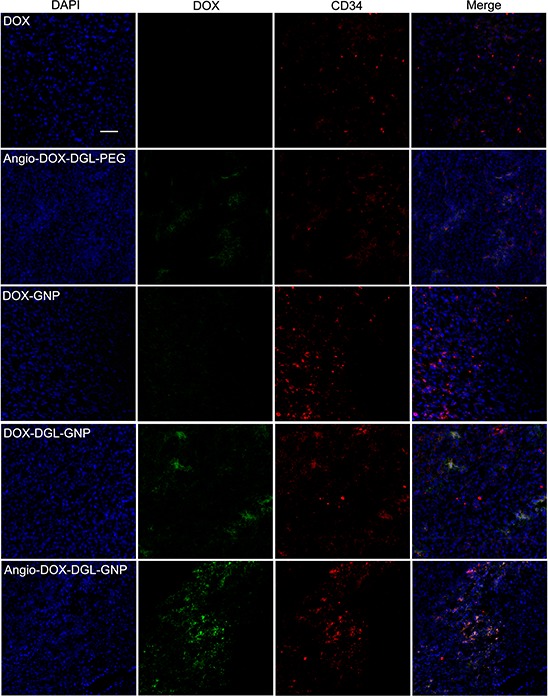
Blue represents DAPI, green represents the fluorescence of DOX, red represents CD34 labeled blood vessels and bar represents 50 μm.
Official websites use .gov
A
.gov website belongs to an official
government organization in the United States.
Secure .gov websites use HTTPS
A lock (
) or https:// means you've safely
connected to the .gov website. Share sensitive
information only on official, secure websites.
Blue represents DAPI, green represents the fluorescence of DOX, red represents CD34 labeled blood vessels and bar represents 50 μm.