
Figure 9. In vivo tumor growth inhibition experiment.
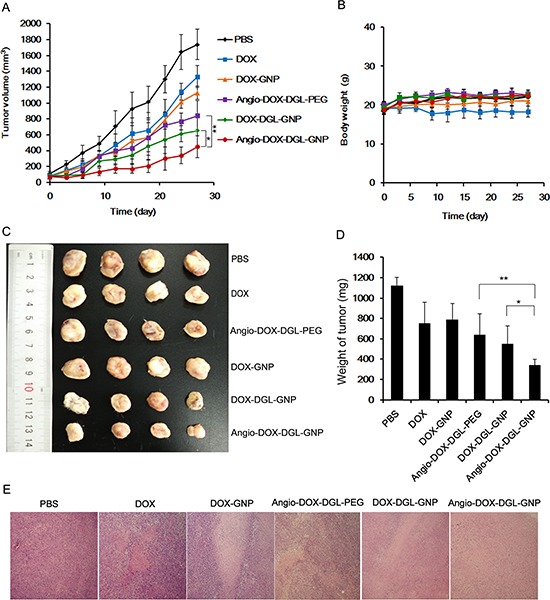
A. The 4T1 tumor growth curves after intravenous injection of different formulations of DOX. B. The body weight of mice after administration of different formulations of DOX and PBS up to day 27 (n = 6). C. The images of tumors of mice obtained from sacrificed mice at the end of this experiment. D. The weight of tumor after 27 days treatment (n = 6). E. Histological images of tumors sections stained by H&E (tumors: × 100).