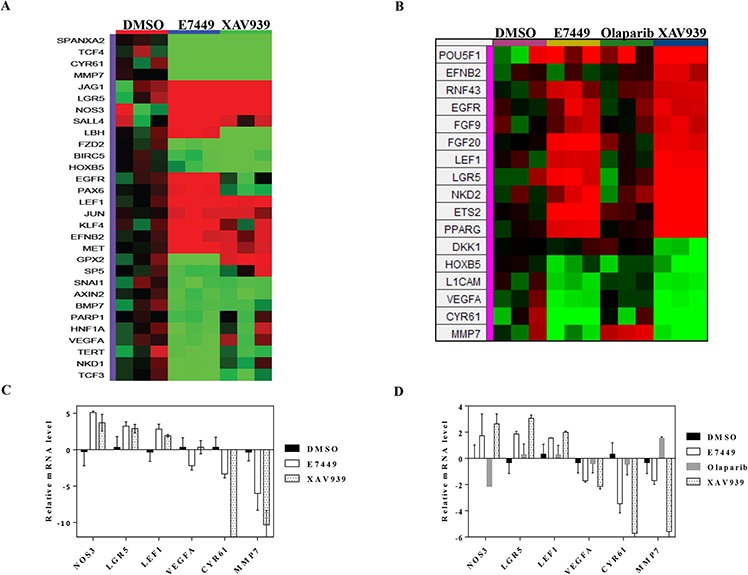
Figure 6. E7449 inhibits Wnt signaling in vitro: effects of E7449 treatment on expression of Wnt-related genes in SW480 cells.

A. following 72 h incubation of SW480 cells with E7449 or XAV939 at 30 μmol/L or DMSO (control), RNA was harvested and gene expression profiling performed using a custom designed TLDA; genes listed in Supplementary Table 2. The heat map represents 30 Wnt-related genes whose expression was altered following E7449 exposure (red: increased, green: decreased). Genes with a relative fold change of ≥ 1.5 (P > 0.05, student's t-test) versus DMSO control were subjected to hierarchical clustering (Manhattan distance) and complete linkage plotting to generate the heat map. B. Gene expression profiling in SW480 cells treated with E7449, XAV939 or olaparib at 3 μmol/L or DMSO for 72 h. Heat map generated as above represents 17 Wnt-related genes whose expression was significantly altered by any of the 3 compound treatments. C. and D. 6 E7449-responsive genes common to both 3 and 30 μmol/L study respectively; data represent mean ± SEM. In general, XAV939 treatment altered gene expression in the same direction as E7449, whereas olaparib treatment had no effect or altered expression in the opposite direction (D).
