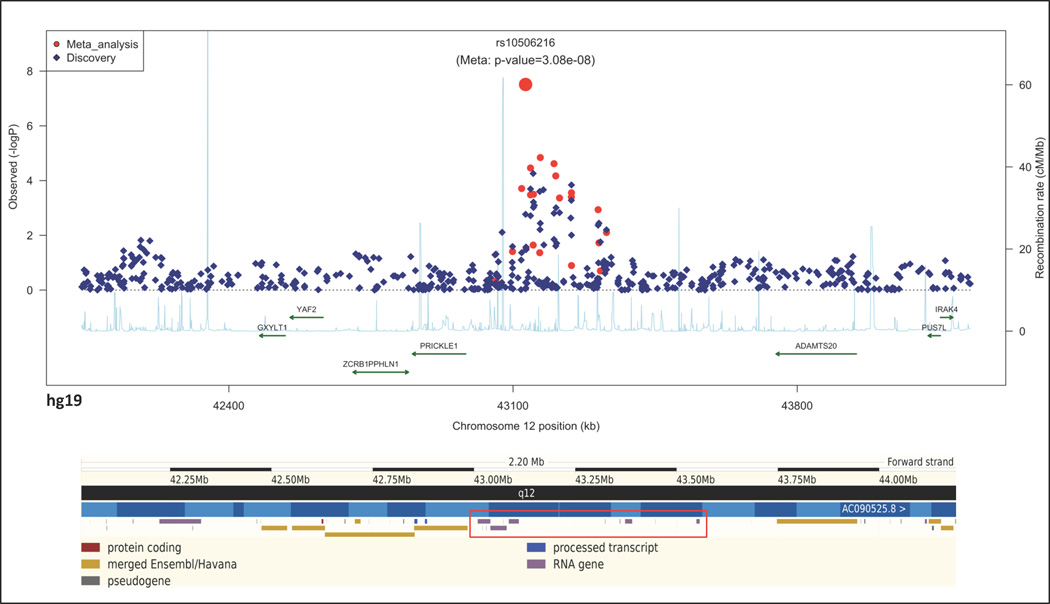
Figure 1. Regional association plot on chromosome 12q12 (top panel) and the region overview of the corresponding chromosome segment in Ensembl genome browser (bottom panel).
TOP PANEL: The associations observed in Stage 1 discovery sample are depicted as dark blue diamonds while the results from the meta-analysis of Stage 1 and Stage 2 samples are shown as red dots. The genes located in the region (based on the UCSC genome browser) and the recombination rates by position (light blue line) are also shown. The most relevant SNP with best meta P is labeled. BOTTOM PANEL: The red rectangle shows the large/long intergenic non-coding RNA (lincRNA) genes that reside adjacent to the SLE association signal in this region.

