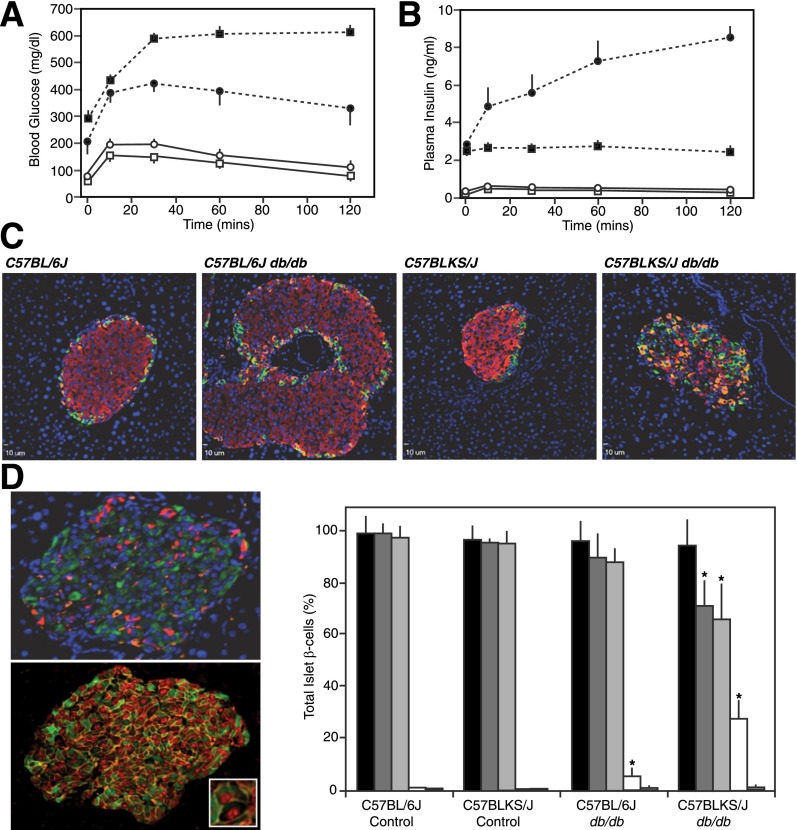
Figure 1.
Pancreatic endocrine phenotype and islet immunofluorescence analysis of obese db/db mouse models. Intraperitoneal injection of glucose (1 g/kg of body weight) in 16-week-old 6J+/+ (○), 6Jdb/db (●), KS+/+ (□), and KSdb/db (■) mice and subsequent analysis of tail blood glucose (A) and plasma insulin levels (B). Data are mean ± SE (n ≥6). C: Representative immunofluorescent images of 14- to 16-week-old mouse pancreatic sections stained for insulin (red), glucagon (orange), and somatostatin (green). D: Representative immunofluorescent images of 10-week-old KSdb/db mouse pancreatic sections stained for insulin (green), glucagon (red), and somatostatin (orange) (top image) or insulin (green), β-catenin (orange), and MafA (red) (bottom image). The inset magnifies an example of an MafA(+)/insulin(−)–empty β-cell. Quantification of MafA(+) and insulin(+) cells from sections of control and db/db mouse pancreas is also shown as the percentage of total islet β-cells: MafA(+) (black bars), insulin(+) (dark gray bars), MafA(+)/insulin(+) (light gray bars), MafA(+)/insulin(−) (white bars), and MafA(−)/insulin(+) (hatched bars). Data are mean ± SE (n = 6). *P ≤ 0.05 indicates a statistically significant difference vs. respective (WT) controls.

