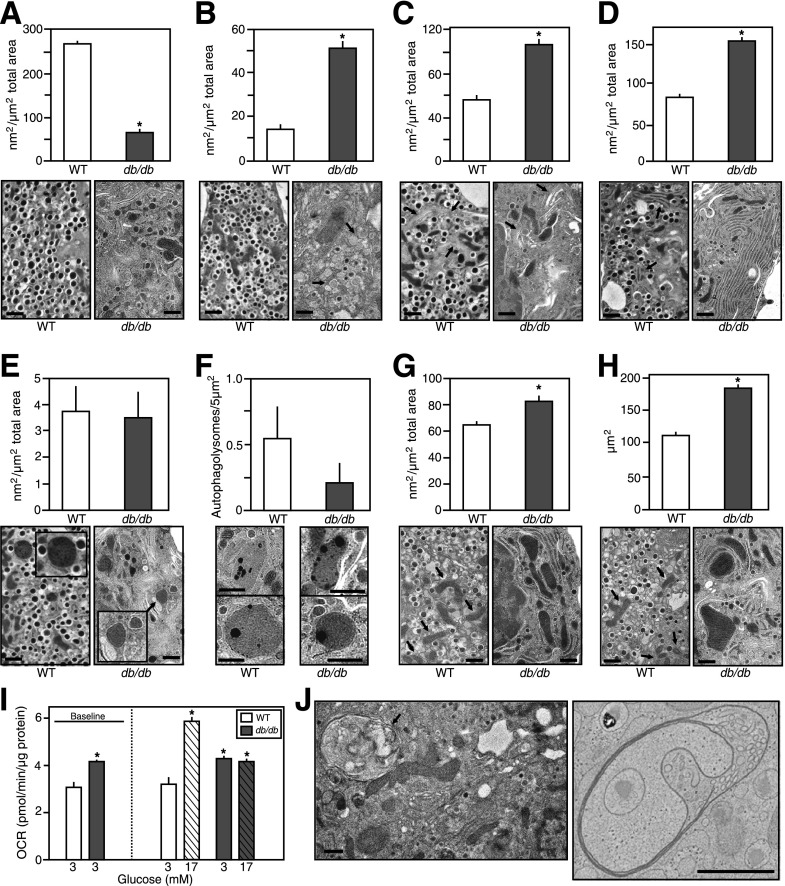
Figure 3.
Quantification of conventional EM analysis of pancreatic islet β-cells from normal vs. obese mice. Islets from 6J+/+ control and obese 6Jdb/db mice were fixed by high-pressure freezing immediately after isolation and analyzed by EM. Images were then collected, and the surface area occupied by certain organelles was quantified as outlined in the research design and methods. Quantification data are mean ± SE (n ≥3 islet isolations, with >100 individual EM images per isolation quantified). Representative images depicting typical organelles from 6J+/+ control or obese 6Jdb/db mouse islet β-cells are shown. Scale bar = 1 μm. A: β-Cell area occupied by mature β-granules. B: β-Cell area occupied by immature β-granules (highlighted by arrows in 6J+/+ mouse β-cell image). C: β-Cell area occupied by Golgi apparatus (highlighted by arrows). D: β-Cell area occupied by RER (highlighted by arrows in 6J+/+ mouse β-cell image). E: β-Cell area occupied by lysosomes (image inset shows ×2 enlarged lysosome images). F: β-Cell area occupied by autophagolysosomes. G: β-Cell area occupied by mitochondria (highlighted by arrows in 6J+/+ mouse β-cell image). H: Average area of individual mitochondria (highlighted by arrows in 6J+/+ mouse β-cell image). I: Basal and glucose-stimulated OCRs of freshly isolated islets from 6J+/+ control or obese 6Jdb/db mouse (as measured by Seahorse Bioscience XF24 instrumentation as outlined in the research design and methods). Data are mean ± SE (n ≥8). J: Example MVBs observed in islet β-cells of obese 6Jdb/db mice. Scale bar = 1 μm. An EM tomogram and 3D reconstruction of the MVB in the right panel are shown in Video 1 and Supplementary Fig. 2. *P ≤ 0.05 vs. respective (WT) controls.

