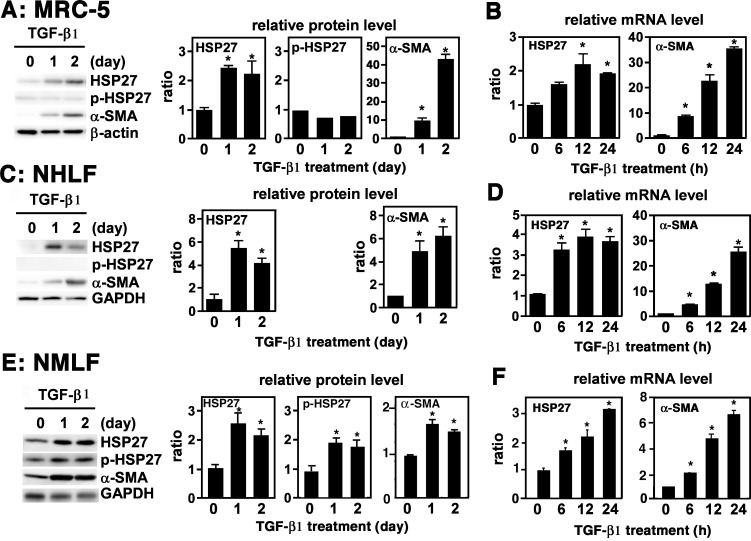
Fig 1. Upregulation of HSP27 in TGF-β1-treated lung fibroblasts.
(A, B) MRC-5. Cells in monolayer were washed twice with PBS to remove FBS, cultured in Opti-MEM for 24 h, and mock-treated or treated with 1 ng/ml of TGF-β1 for the indicated lengths of time. (A) Immunoblot analysis. Protein levels of HSP27, p-HSP27, and α-SMA were determined by immunoblot analysis. For a loading control, β-actin was used. Signal intensities were quantified using Image J software and normalized by β-actin. A representative image from four independent experiments is shown in the left. Quantitative data are shown as mean ± SE (n = 4) in the right. *: P<0.05 by one-way ANOVA. (B) Quantitative PCR. Expression levels of HSP27 and α-SMA mRNAs were determined by quantitative PCR and normalized by GAPDH. Data are shown as mean ± SE (n = 4). *: P<0.05 by one-way ANOVA. (C, D) NHLF. Cells in monolayer were washed twice with PBS, cultured in Opti-MEM for 24 h, and mock-treated or treated with 2 ng/ml of TGF-β1 for indicated length of time. (C) Immunoblot analysis. This was performed as described above. For a loading control, GAPDH was used. A representative image from four independent experiments is shown in the left. Quantitative data are shown as mean ± SE (n = 4) in the right. *: P<0.05 by one-way ANOVA. (D) Quantitative PCR. This was performed as described above. Data are shown as mean ± SE (n = 4). *: P<0.05 by one-way ANOVA. (E, F) NMLF. Cells in monolayer were washed twice with PBS, cultured in Opti-MEM containing 1% FBS for 24 h, and mock-treated or treated with 4 ng/ml of TGF-β1 for the indicated length of time. (E) Immunoblot analysis. This was performed as described above. For a loading control, GAPDH was used. A representative image from six independent experiments is shown in the left. Quantitative data are shown as mean ± SE (n = 6) in the right. *: P<0.05 by one-way ANOVA. (F) Quantitative PCR. This was performed as described above. Data are shown as mean ± SE (n = 6). *: P<0.05 by one-way ANOVA.

