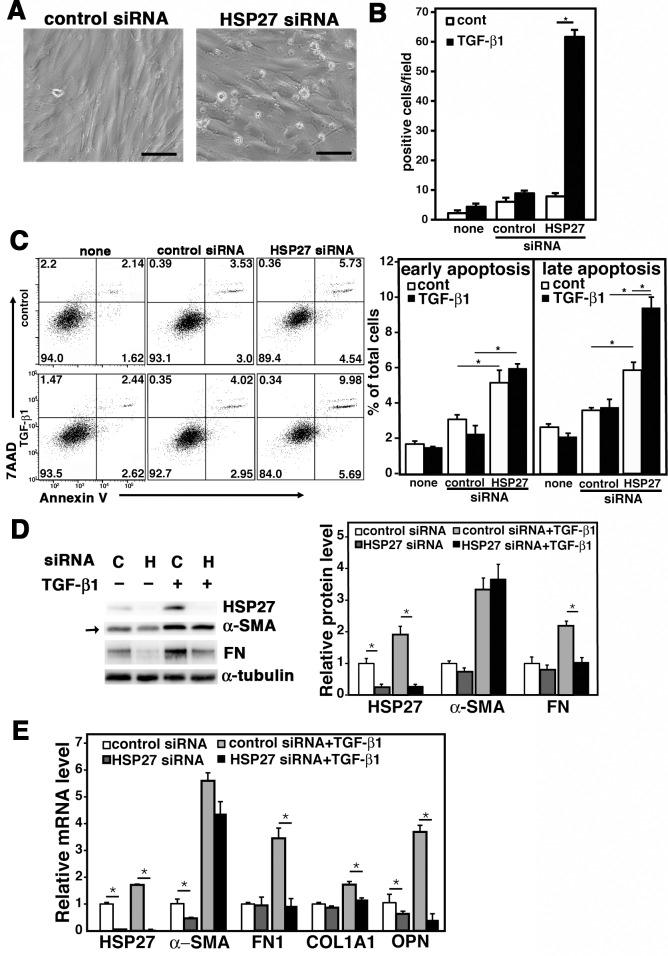
Fig 2. Effect of HSP27 siRNA on TGF-β1-treated MRC-5.
MRC-5 cells were transfected with control or HSP27 siRNA and cultured for 24 h. After washing to remove FBS, cells were placed in Opti-MEM and treated with 0.5 ng/ml of TGF-β1 for 48 h. (A) Phase contrast microscopic images. Representative results from three independent experiments are shown. The bars indicate 100 μm. (B) Cell viability assay. Dead cells were detected by staining in situ with 5 μg/ml of propidium iotide (PI). PI-positive cells in each field (44 mm2) were counted on a fluorescence microscope. Data are shown as mean ± SE (n = 6). *: P<0.05 by Student’s t-test. (C) Apoptosis assay. Apoptotic cells were detected by flow cytometry using the Annexin V and 7AAD double staining assay. The FACS plots are shown in the left with % of cells in the four gated areas. Columns in the right show % of cells in early apoptosis (Annexin V+ and 7AAD‒) and late apoptotosis (Annexin V+ and 7AAD+) as mean ± SE (n = 3). *: P<0.05 by Student’s t-test. (D) Immunoblot assay. MRC-5 cells were transfected with control siRNA “C” or HSP27 siRNA “H” and cultured for 24 h. Then, after changing the culture medium to Opti-MEM containing 2% FBS, cells were treated with or without 0.5 ng/ml of TGF-β1 for 48 h. Protein levels of HSP27, α-SMA and fibronectin (FN) were determined by immunoblot analysis. For a loading control, α-tubulin was used. Quantitative data are shown as mean ± SE (n = 4) in the right. *: P<0.05 by Student’s t-test. (E) Quantitative PCR. MRC-5 cells were transfected with control or HSP27 siRNA and cultured for 24 h. Then, after changing the culture medium to Opti-MEM containing 2% FBS, cells were treated with or without 0.5 ng/ml of TGF-β1 for 24 h. Expression levels of HSP27, α-SMA, FN1, α1 type I collagen (COL1A1) and opsteopontin (OPN) mRNAs were determined by quantitative PCR and normalized by GAPDH. Data are shown as mean ± SE (n = 6). *: P<0.05 by Student’s t-test.

