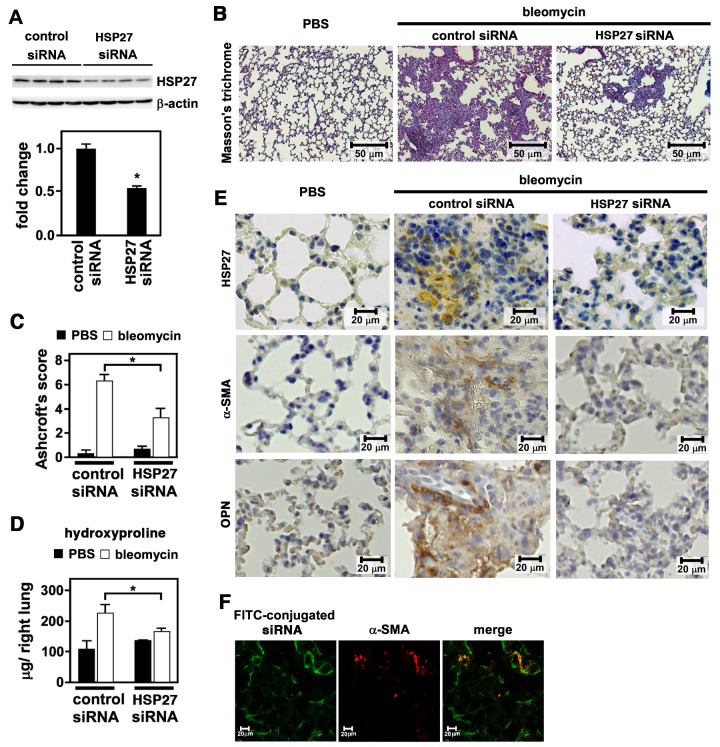
Fig 5. Effect of HSP27 siRNA on bleomycin-induced pulmonary fibrosis in mice.
Mice were intratracheally treated with PBS or bleomycin. On day 4, 6, 9, and 12, mice were intranasally inoculated with 5 μg of control siRNA or HSP27 siRNA using MaxSuppressor In Vivo RNA-LANCEr II. On day 14, mice were sacrificed and lungs were removed. (A) Immunoblot analysis. Protein levels of HSP27 were analyzed by immunoblotting using tissue lysates prepared from right lungs. As a loading control, β-actin was used. A representative image from six independent experiments is shown (above). Quantitative data are shown as mean ± SE (n = 6) (below). *: P<0.05 by Student’s t-test. (B) Masson’s trichrome staining. This was performed using tissue sections from left lungs. Representative images from three independent experiments are shown. The bars indicate 50 μm. (C) Ashcroft’s Score. Fibrosis levels were quantified by Ashcroft’s Score. Data are shown as mean ± SE (n = 7). *: P<0.05 by Student’s t-test. (D) Hydroxyproline content. Tissue homogenates prepared from right lungs were used to determined hydroxproline contents. Data are shown as mean ± SE (n = 7). *: P<0.05 by Student’s t-test. (E) Immunohistochemical staining. Tissue sections from left lungs were immunohistochemically stained for HSP27, α-SMA, and OPN. Representative images from three independent experiments are shown. The bars indicate 20 μm. (F) Airway delivery of FITC-labeled siRNA. Mice were intratracheally treated with bleomycin. On day 4, mice were intranasally inoculated with 5 μg of FITC-labeled siRNA mixed in MaxSuppressor In Vivo RNA-LANCEr II. After 1 h, lungs were removed and frozen sections were made. Tissue sections were fixed and stained for α-SMA. FITC (green) and α-SMA (red) were observed on a fluorescence microscopy. Representative images from four independent experiments are shown.

