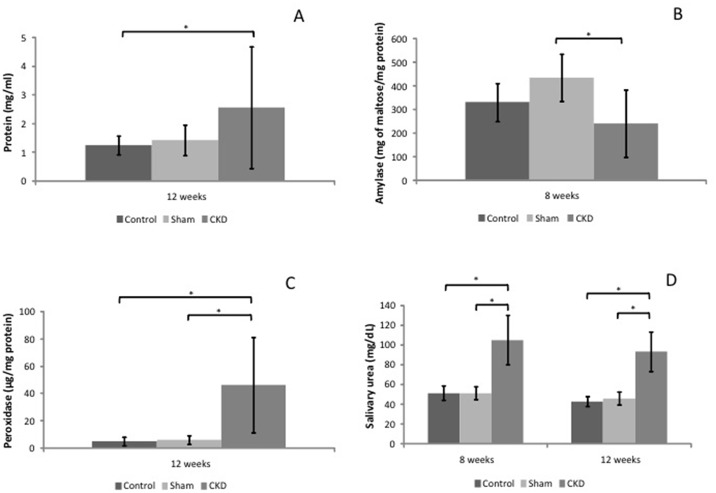
Fig 2. Representative graphics of analyzed saliva stimulated by pilocarpine (1mg/Kg of b.w.).
(A) Salivary total protein concentrations from Control, Sham and CKD groups at the experimental period of 12 weeks. (B) Salivary amylase activities from Control, Sham and CKD groups at the experimental periods of 8 weeks. (C) Salivary peroxidase activities from Control, Sham and CKD groups at the experimental period of 12 weeks. (D) Salivary urea concentrations from Control, Sham and CKD groups at the experimental periods of 8 and 12 weeks. * indicates significant differences between indicated groups (p< 0.05).

