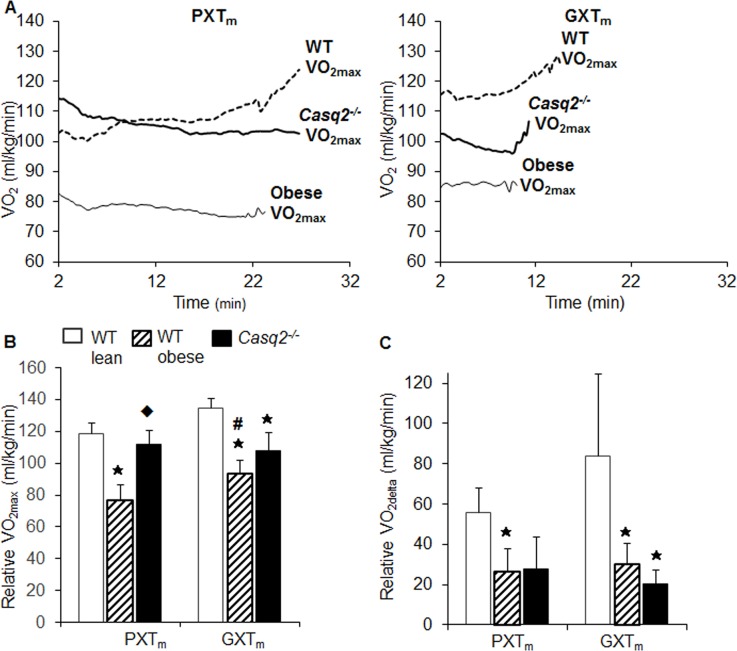
Fig 3. VO2max achieved with the GXTm, but not the PXTm, identifies impaired cardiovascular fitness in mouse models of cardiovascular dysfunction.
(A) Averaged VO2 kinetics obtained from WT (dashed line), Casq2-/- (solid thick line), and obese (solid line) mice that performed the PXTm and GXTm. VO2 is indicated for each group from the beginning of the test until the end (Minute 2, after the 2 minute warm, to point of exhaustion). Of note, during the PXTm, the largest increase in VO2 occurred with the first stage, and leveled off as the test continued in dysfunctional models. (B) Relative VO2max values and (C) change from baseline to maximal oxygen consumption (VO2delta) are compared (mean±SD, MANOVA, Tukey HSD Multiple Comparisons, alpha = .007) in WT-healthy (white bar), WT-obese (hashed bar), and Casq2-/- (black bar) mice. Asterisks indicate significance at the alpha = .007 level (MANOVA, multiple comparisons Tukey HSD for the PXTm and GXTm of WT v. obese and WT v. Casq2-/-), hash indicates significant difference at the alpha = .05 level between tests for the same genotypes (Student’s t-Test), and diamond indicates significance at the alpha = .007 level (MANOVA, multiple comparisons Tukey HSD for the PXTm and GXTm of obese v. Casq2-/-).

