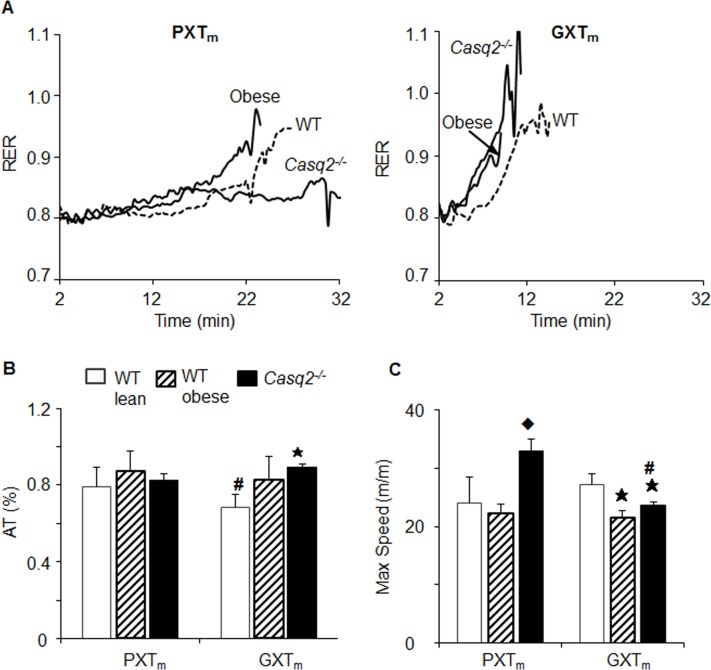
Fig 5. Anaerobic threshold and maximum speed assess dysfunction in mice with the GXTm, but not the PXTm.
(A) Average RER kinetics from same from WT (dashed line), Casq2-/- (solid thick line), and obese (solid line) mice performed the PXTm and GXTm. (B) AT was reported as %AT, a time point where AT occurred/total test time in mouse groups (Fig 3). (C) Maximum speed achieved on test (m/m). For all measures, asterisks indicates significance at the alpha = .007 level (MANOVA, multiple comparisons Tukey HSD for the PXTm and GXTm of WT v. obese and WT v. Casq2-/-), hash indicates significant difference at the alpha = .05 level between tests for the same genotype (Student’s t-Test), and diamond indicates significance at the alpha = .007 level (mean ± SD, MANOVA, multiple comparisons Tukey HSD for the PXTm and GXTm of obese v. Casq2-/-).

