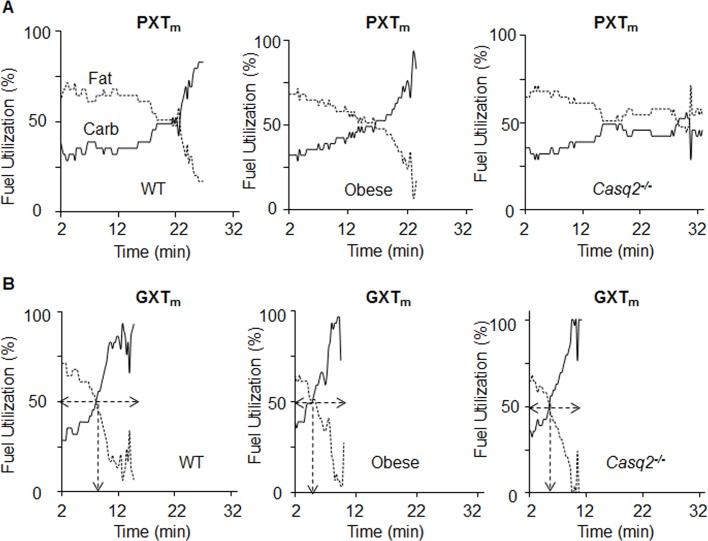
Fig 6. Carbohydrate and fat oxidation kinetics can be used to identify the crossover point in the GXTm, but not the PXTm.
Averaged fuel utilization kinetics in WT (n = 7), obese (n = 11), and Casq2-/- (n = 4) mice. Fat (dashed line) and carbohydrate (Carb, solid line)) oxidation were derived from RER as described in S3 Table during the PXTm (A) and GXTm tests (B). In GXTm tests, the arrow indicates crossover, the point at which carbohydrate and fat oxidation intersect (dashed arrows).

