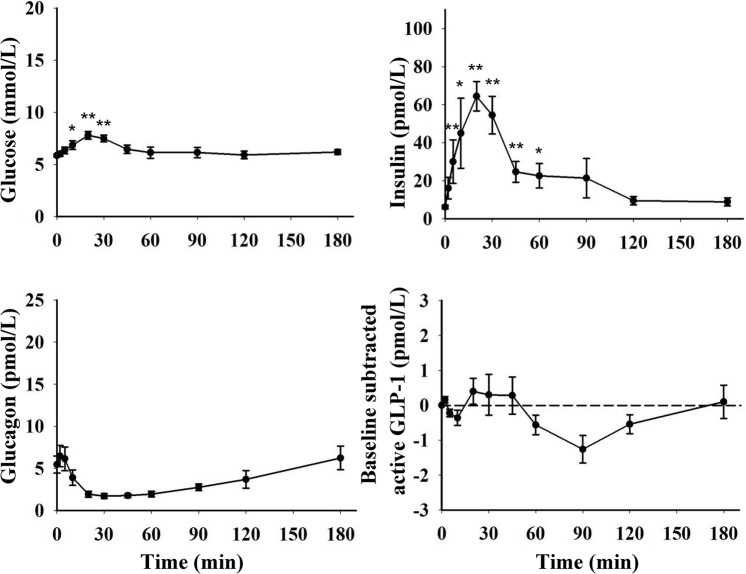
Fig 3. Blood glucose concentrations and plasma levels of insulin, glucagon and baseline subtracted (change from fasting levels) active GLP-1 during OGTT (1.75 g/kg BW, n = 9 for blood glucose and plasma insulin, n = 5 for plasma glucagon and active GLP-1) in growing pigs.
* indicate a significant increase and † a significant decrease compared to fasting levels (*, † = p<0.05; **, †† = p<0.01; ***, ††† = p<0.001).

