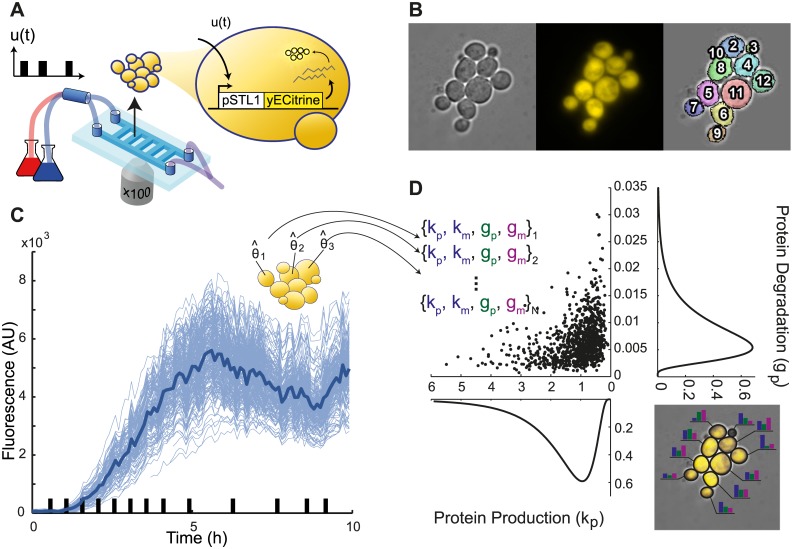
Fig 1. Experimental setup and principle of single-cell parameter estimation.
A. Microfluidic device enabling the growth and imaging of yeast cells over extended durations while applying repeated hyperosmotic shocks by rapidly switching their environment between normal and hyperosmotic media. Using a reporter gene that drives the transcription of the yellow fluorescent protein yECitrine under control of the osmoresponsive promoter pSTL1, one can track the transcriptional response of cells to repeated osmotic shocks. B. Thanks to segmentation and tracking algorithms, the response of single-cells can be measured over several generations. C. As a result we obtain single-cell trajectories (thin blue lines) that show the variability in cells response to hyperosmotic stress. The thick blue line represents the median behavior. Black bars on the x-axis represent the hyperosmotic shocks applied to cells. D. From these trajectories, our goal is to extract the parameters of a standard model of gene expression (see text) for each cell, and therefore a multidimensional distribution describing the cell-to-cell variability. As an illustration, the right inset shows that different cells will be modeled with different parameter values to account for their own specific behavior.

