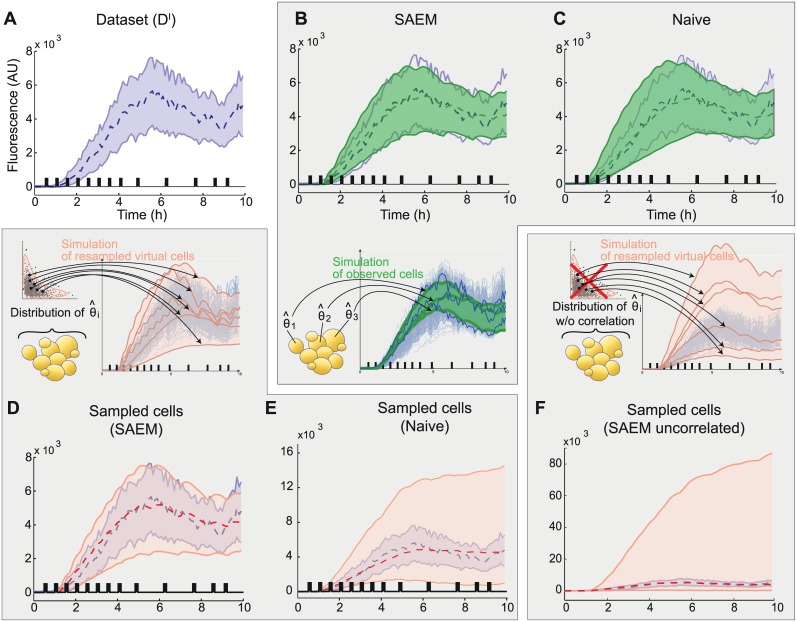
Fig 2. The SAEM approach provides parameter distributions that capture the population behavior because of cross-correlations between parameters.
A. Representation of the experimental dataset. B. Simulated behavior obtained when using the parameters of each observed cell in the dataset (325 cells) inferred with the SAEM approach. C. Simulated behavior obtained when using the parameters of each observed cell in the dataset (325 cells) inferred with the naive approach. D. Simulated behavior of 10000 cells when resampling the population joint distribution inferred with SAEM, (pink). E. Simulated behavior of 10000 cells when resampling the population joint distribution inferred with the naive approach. F. As an illustration we show the simulated behavior of 10000 cells when resampling the population parameter distribution as in D but without preserving the covariance between parameters (i.e., using marginal distributions). For E and F, note that the y-axis has been scaled differently. Shaded areas represent the fluorescence values of 95% of the population and the dashed lines represent the median. Experimental data is represented in blue. Black bars indicate the presence of osmotic shocks. Note that unlike actual cells, all simulated cells are represented during the whole experiment (ie from 0 to 10hrs).

