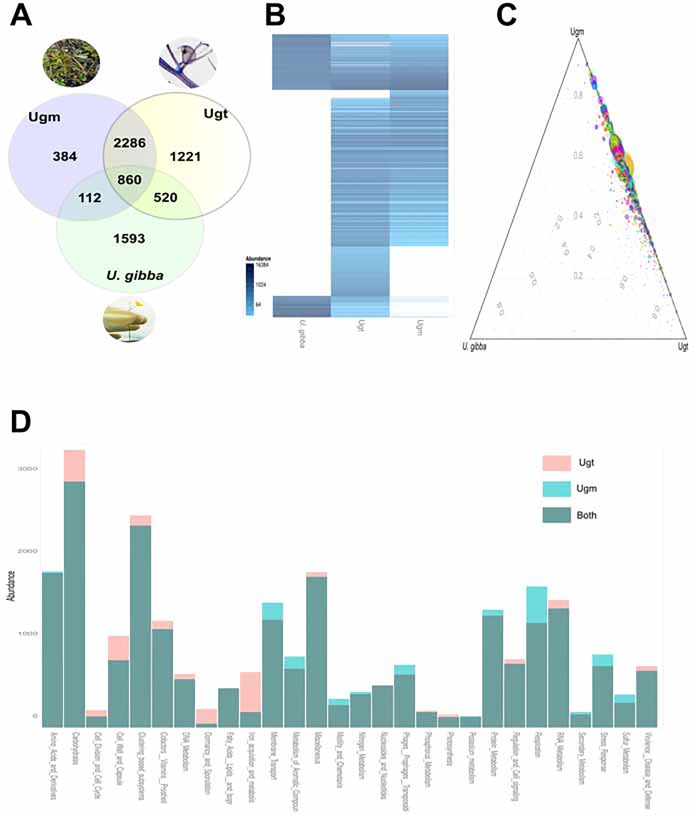
Fig 5. Comparative functional genomics and the complement between U. gibba's genome, and its trap (Ugt).
(A) Venn diagram comparing the amount of shared genes between the plant's genome, Ugt, and Ugm (using KEGG orthologs). (B) A Heat-map showing the overall metabolic complement supplied by Ugt, note that most of this complement is shared with Ugm and only a subset is in greater abundance in Ugt. (C) A ternary plot in which each dot corresponds to a KEGG ortholog and its diameter is proportional to its abundance. This plot shows that most of the predicted gene functions are shared between Ugt and Ugm, whereas a minimal portion of genes are shared directly between Ugt, Ugm and the plant's genome. (D) Major functions coded by both U. gibba's trap (Ugt) and its medium (Ugm). The categories used correspond to level 1 of the SEED's hierarchy.

