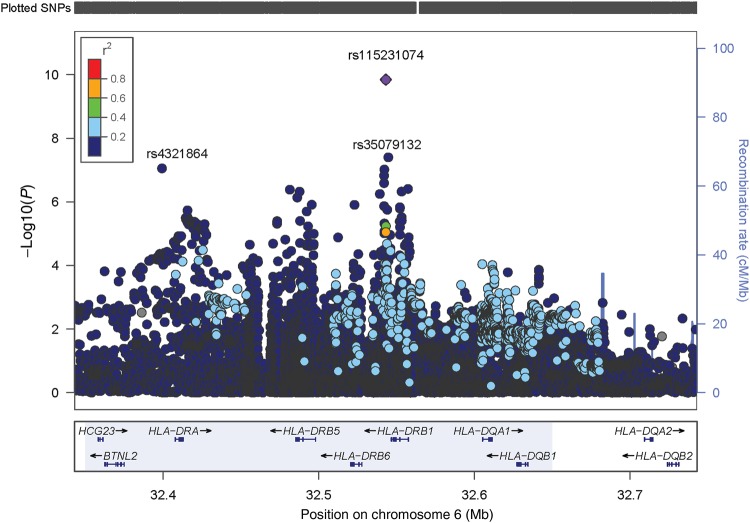
Figure 1.
Primary (all Staphylococcus aureus infections) phenotype: focused view of the locus of genotyped and imputed single-nucleotide polymorphisms (SNPs) between 32.3 and 32.5 Mb on chromosome 6. The plot also shows the SNP location in relation to known genes in that locus. Linkage disequilibrium of index SNP rs115231074 with other plotted SNPs is shown as a range of r2 values, in which red = 0.81–1.0, orange = 0.61–0.80, green = 0.41–0.60, light blue = 0.21–0.40, and dark blue = 0.01–0.20.

