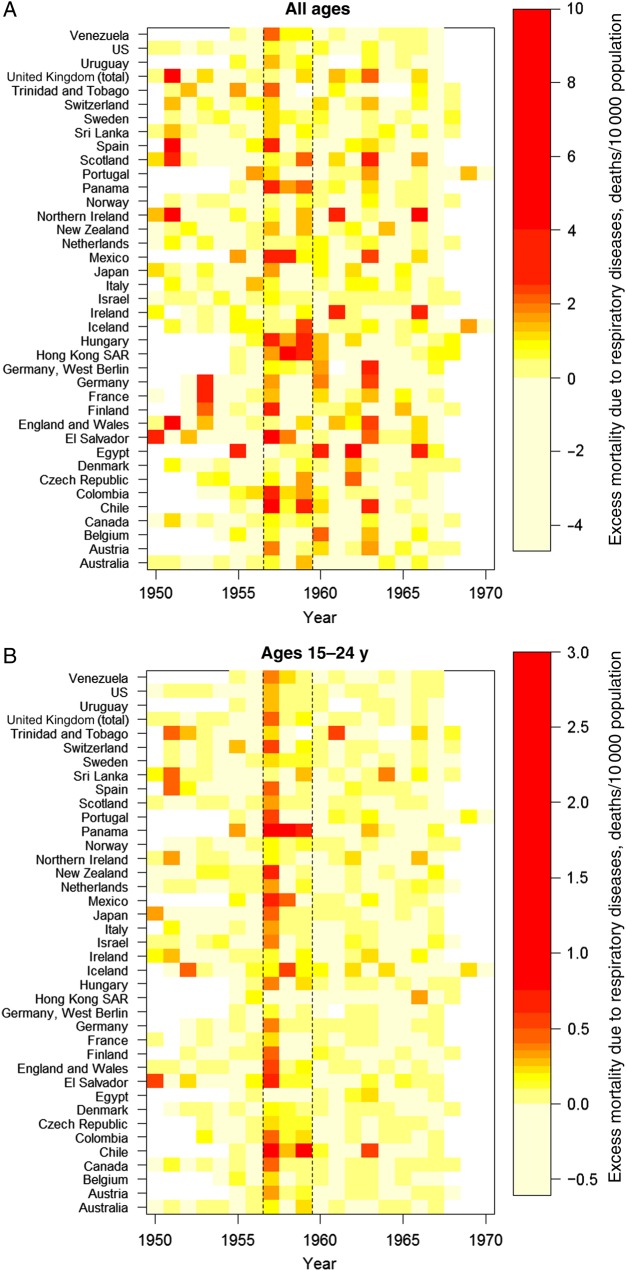
Figure 1.
Country-specific influenza-related excess mortality rates from respiratory causes, 1950–1970. Excess mortality rate is calculated as the observed annual mortality rate minus a model-predicted spline baseline fitted to the mortality rate outside the 1957–1959 pandemic period. The 2 black vertical lines highlight mortality attributable to the pandemic period. A, All-age mortality. B, Mortality among individuals aged 15–24 years, the age group with the highest increase in mortality, relative to baseline, during the pandemic period. Mortality rates range from low (yellow) to high (red). Abbreviation: SAR, Special Administrative Region.

