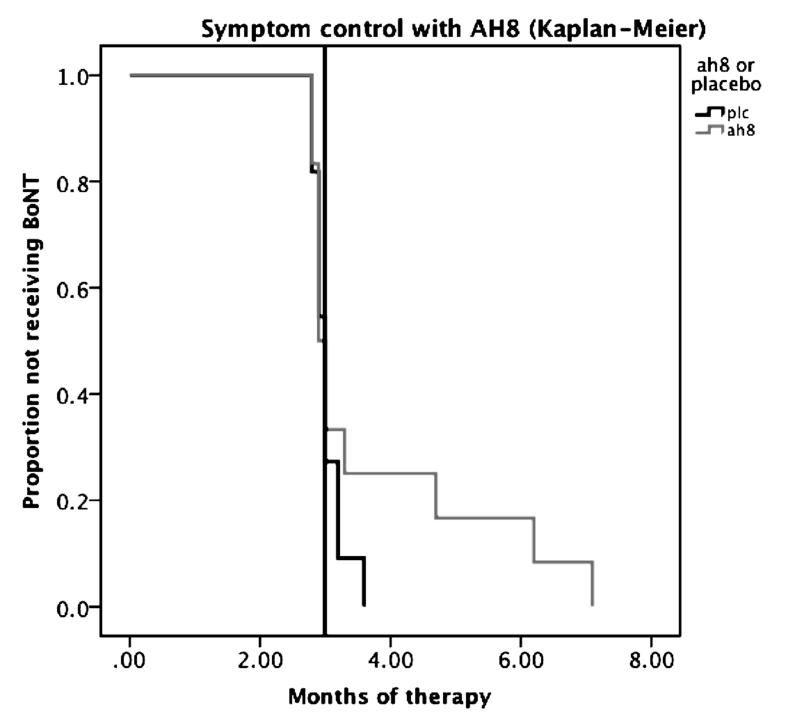
Figure 2.
Kaplan-Meier curve illustrating the return to baseline JBRS after BoNT treatment. The interpolation line is at 3 months, the usual duration of action of the regularly scheduled BoNT injections in this group of patients. A clear separation of the active and placebo groups can be seen beyond this point in terms of return to baseline severity.

