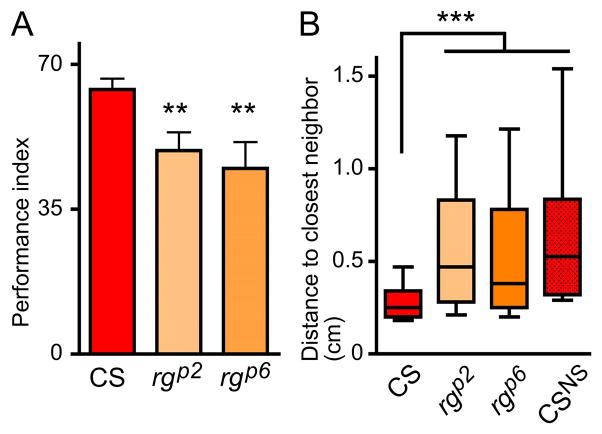
Figure 7. rg mutations cause disruptions in adult social behavior.
(A) rg mutants do not avoid dSO. Bar graph represents the average ± SEM of the Performance Index (PI) of avoidance of the stress odor left by agitated flies; n=5 independent trials of 2 to 3 internal replicates with 40 flies each (p<0.03, ANOVA, compared to CS p<0.01**). (B) rg mutants are indifferent to other flies in a social group (p<0.0001, Kruskal-Wallis). Box and whiskers graphs represent the distribution of distance to the closest neighbor in cm, with Turkey’s whiskers; data represent three independent experiments with two to three internal replicates of 40 flies. More than 50% of CS flies stayed between 0–0.25 cm away from their closest neighbor, or within around one body length of each other (three independent replicates of two to three internal replicates of 40 flies, n= 240 flies). rgp2 (n= 280 flies) and rgp6 (n= 320 flies) exhibited less social interaction, preferring to be further apart overall. Their distribution is not different from that of CSNS obtained when analyzing a merged image of 40 single flies (“CS, No Social interactions”), suggesting that the flies’ distribution is independent of the presence of other individuals.

