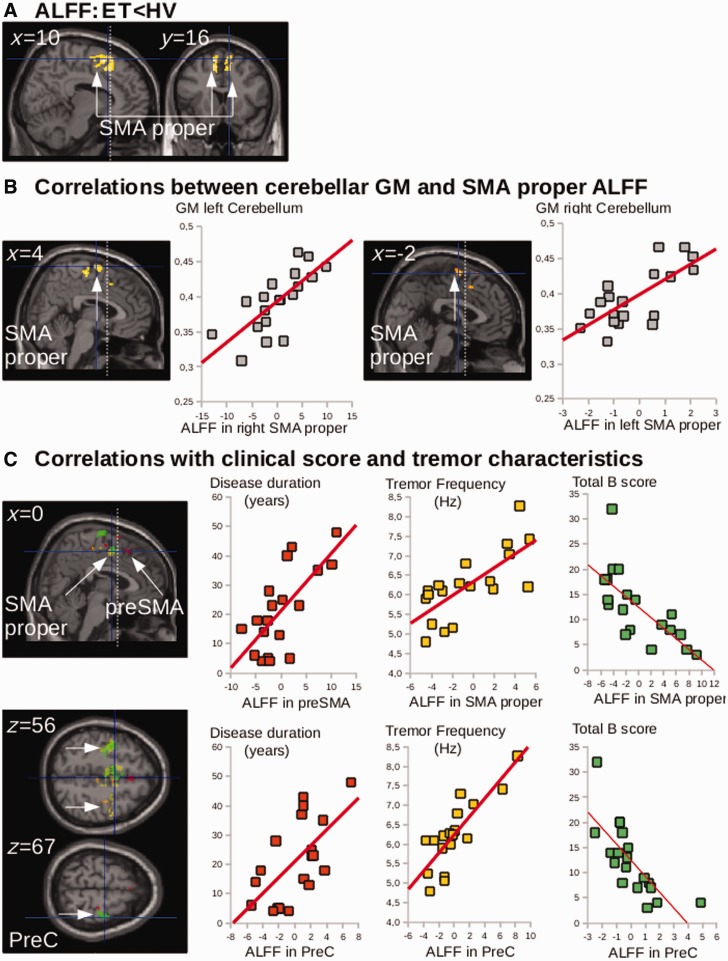
Figure 3.
Group differences in ALFF and correlation with clinical scores. (A) Statistical parametric maps showing the decrease in ALFF in both SMAs of the essential tremor patients (ET) as compared with the healthy volunteers (HV) (clusters are significant at P < 0.05, corrected for multiple comparisons). (B) Multiple regression showing the correlation between the SMA ALFF and cerebellar grey matter atrophy in the opposite hemisphere (P < 0.05, FWE correction). (C) Multiple regression showing that ALFF in the SMA and precentral gyrus correlated with disease duration (red), clinical scores (green) and tremor characteristics (yellow). Clusters are superimposed on the SPM canonical brain. Plots show the correlation between the global maximum in both SMAs and in the right precentral gyrus (PreC) (see Table 2 for statistical details and MNI coordinates). The cerebral parameters (individual values) showing the correlations with clinical parameters were calculated voxel-by-voxel in the regions of interest of cerebellar- motor circuit: the cerebellum, dentate, thalamus and cortical motor areas.

