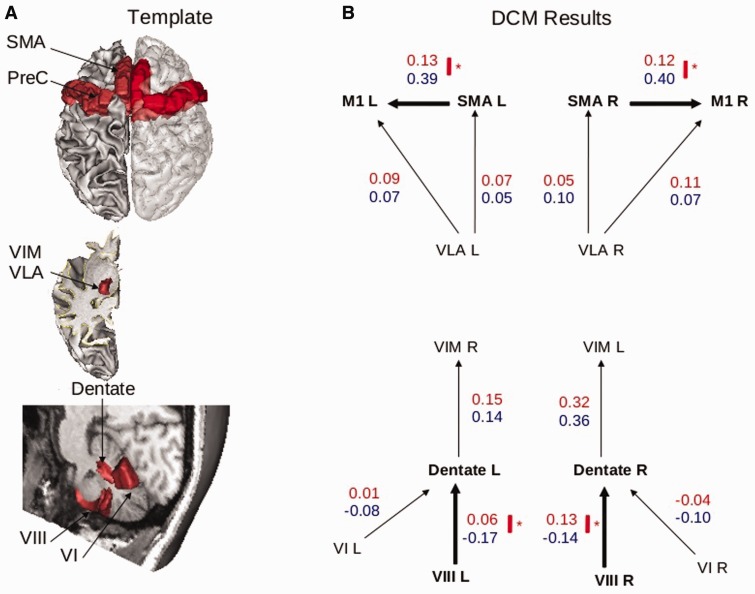
Figure 4.
Results of DCM analysis. (A) Template of cortical motor, thalamic and cerebellar regions involved, a priori, in the CDTC loop and considered in the DCM model definition. (B) Structure of the DCM models including the thalamo-cortical models (top) and the cerebello-thalamic models (bottom). Only the winning models of the thalamo-cortical (left and right hemispheres) and cerebello-thalamic models are represented, with the group averaged endogenous connectivity parameters (red = patients; blue = healthy volunteers). Thick arrows represent significant group differences in the average strength of connectivity (*P < 0.05, corrected for multiple comparisons).

